So a few posts ago I cavalierly wrote how easy it was to add a timestamp to lvmstat for unattended data gathering when hotspot hunting. (Hotspot hunting ain't easy unless you can time-align lvmstat and iostat data.) I was overconfident, in my own awk abilities at the very least.
Sure, I found the hot logical partitions when I was reviewing data. But every single one of my timestamps in the log had the same value! Criminey! It took me forever to spreadsheet-mod my way out of that in order to create some decent looking spreadsheet and graph data.
If you McGoogle "lvmstat", "awk", and "timestamp" I don't think you'll find very much that is helpful in allowing time-aligning of unattended lvmstat logs with iostat logs. Maybe there's a compact answer somewhere, but I didn't find it... don't wanna brag but I'm a pretty good McGoogler. Most of the responses in various forums resulted in the same stale date timestamp values, collected at the beginning of script execution and repeated throughout. Eventually I was able to get a date timestamp value that was updated throughout execution... but then I had extra linebreaks that I didn't want.
My pain... your gain. Here's what I ended up with*.
# ###find top 4 partitions, 5 second interval, 4 iterations
# lvmstat -s -l sasquatch_lv -c4 5 4 | awk -u '{ORS=" ";} {print $0 ; system("date") ; close("date") ; }'
Wed Jul 31 16:40:16 CDT 2013
Log_part mirror# iocnt Kb_read Kb_wrtn Kbps Wed Jul 31 16:40:16 CDT 2013
45 1 39773 16 340312 0.02 Wed Jul 31 16:40:17 CDT 2013
1 1 16298 0 425208 0.02 Wed Jul 31 16:40:17 CDT 2013
3 1 5428 0 685612 0.03 Wed Jul 31 16:40:17 CDT 2013
2 1 4528 0 480760 0.02 Wed Jul 31 16:40:17 CDT 2013
... Wed Jul 31 16:40:26 CDT 2013
Yay! A small victory, but I'll take it.
*This isn't really the end of course... there's a bit more cleanup. The empty first line can be removed, the lines that represent no change in values and have only periods and timestamps can be removed. Those are left as exercises for the reader. :)
***** Update sql_sasquatch 10/03/2013 *****
I pulled this out today to make sure it really works and that I wasn't just conveniently ignoring timestamps that weren't updating as desired. Nope, its working like I thought.
# lvmstat -s -l lv_unicorn -c4 5 20 | awk -u '{ORS=" ";} {print $0 ; system("date") ; close("date") ; }'
Thu Oct 3 15:00:45 CDT 2013
Log_part mirror# iocnt Kb_read Kb_wrtn Kbps Thu Oct 3 15:00:45 CDT 2013
77 1 146 0 592 0.06 Thu Oct 3 15:00:45 CDT 2013
75 1 91 144 240 0.04 Thu Oct 3 15:00:45 CDT 2013
78 1 88 4 348 0.04 Thu Oct 3 15:00:45 CDT 2013
85 1 80 4 2412 0.26 Thu Oct 3 15:00:45 CDT 2013
. Thu Oct 3 15:00:55 CDT 2013
85 1 2 0 52 11.11 Thu Oct 3 15:00:55 CDT 2013
....... Thu Oct 3 15:01:35 CDT 2013
75 1 7 0 28 5.80 Thu Oct 3 15:01:35 CDT 2013
85 1 7 0 148 30.67 Thu Oct 3 15:01:35 CDT 2013
77 1 5 0 20 4.15 Thu Oct 3 15:01:35 CDT 2013
40 1 4 0 16 3.32 Thu Oct 3 15:01:35 CDT 2013
........ Thu Oct 3 15:02:15 CDT 2013
85 1 2 0 124 21.96 Thu Oct 3 15:02:15 CDT 2013
Wednesday, July 31, 2013
Friday, July 26, 2013
Multiple db block sizes in Oracle? Consider this....
This post is just a tease, maybe I'll be able to add more details later. Oracle 11.2.0.3 database instance I've been watching, with a 7.5 gb SGA target, was performing over 2 million physical reads in a 6 hour period against a single table that was only ~11,000 8k blocks/~100 mb. Yikes!
An important detail - this instance used three different database block sizes 8, 16, and 32 k. Oracle database allows the use of multiple database block sizes within a single database instance. That strategy is tricky, and most folks will warn against doing that. Its tricky to manage multiple database caches for each block size with priority and churn rate in mind.
It gets even trickier. Oracle 11gR2 plans are by default biased toward full table scans and fast full index scans. And the execution engine will decide whether a FTS or FFS will go to PGA or SGA.
Consider that multiple concurrent queries each performing the exact same FFS/FTS against concurrent IO (cio) files will EACH perform physical reads for the scan into PGA. In the case I'm thinking of, the talbe was only ~11,000 8k blocks - about 100 mb. WIth an mbrc of 128, about 100 reads should be enough to get it into one queries PGA, right? Well... unless the table is fairly fragmented... within a very fragmented file. The system I observed required nearly lots more than 100 reads for each full table scan of this table.
And, the system did a lot of full table scans requiring physical reads. There's a parameter called _small_table_threshold that the execution engine considers when making its decision for direct path read into PGA vs read into SGA database cache for a FTS/FFS. By default, _small_table_threshold is 2% of the database cache. Multiply that by 5 - or by default 10% of the database cache size. Only tables larger than that can qualify for FFS/FTS direct path read (DPR) to PGA.
But, the table was only ~100 mb - and the instance had 7.5 gb SGA target. Surely a 100 mb table would fit in the database cache and the frequency of access would keep it there - so logical IO would be high but physical IO would be low.
Well... except for the multiple database block sizes, and multiple database cache sizes, with a separate cache for each block size. As I continued observation, in one call I noted that I was in personally uncharted territory... I wasn't certain but I suspected Oracle would use ~10% of the relevant cache for that block size as the threshold for DPR=>PGA eligibility. The kicker: the 100 mb table was made of 8k blocks, and the 8k cache was 500 mb. So the 100 mb table qualified for DPR=>PGA!
We'll introduce a performance intervention over the weekend - move the table object and the single index (pk index) from an 8k table space to a 16k table space. The 16k database cache size is ~3.5 gb. So the 100 mb table will be under the DPR=>PGA qualifying threshold. I expect physical reads against that table to decrease from over 2 million in that 6 hour period to a couple thousand. If that works out, it'll build momentum for standardizing this instance on a single block size (among a number of other interventions). :)
Sorry I couldn't include lots of cool stuff in here like specific numbers, charts, graphs, a repro/demo example.
But I know that lots of systems are struggling under the physical read rate after transitioning to Oracle 11gR2. Sometimes the struggle begins only after a specific table reaches a given size... and then it can be a real puzzle to untangle. This might be an important piece of your puzzle so I wanted to get the word out.
Thursday, July 25, 2013
MSSQL Backups - check HBA maximum transfer size
Background reading on the T-SQL backup command, to get you warmed up.
http://msdn.microsoft.com/en-us/library/ms186865.aspx
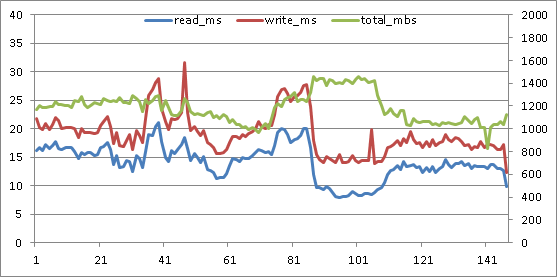
Below is a graph from perfmon numbers collected in 15 second intervals. Don't laugh - it takes me forever to make graphs that look this cheesy :)
The primary vertical axis on the left is measured in seconds, for the average read latency (blue) and average write latency (red). Secondary vertical axis on the right is measured in megabytes per second, for the sum of read and write throughput.
The horizontal axis is a count of the 15 second intervals elapsed during the monitored activity.
This system has a simple recovery mode, multi-file database being backed up, using SQL Server backup compression. Eight equally sized LUNs each host a single MSSQL database row file. A single backup target LUN has lots and lots of backup target files. The read and write latencies, and the throughput graphed below are aggregates across those 8 database file and single backup target LUNs.

This backup was tuned while the database was operational on a different database server and a different SAN. The best elapsed time for the backup on that system was achieved with numerous target files, 4 mb MAXTRANSFERSIZE for SQL Server backup IO, and a large amount of buffers specified in BUFFERCOUNT.
Migrating the system to a new server and new storage is a great time to recalibrate SQL Server backup. However, the backup was faster on the new system out of the box than on the older system - it seemed good enough so wasn't recalibrated. Maybe that's the way things would have stayed, too, if I hadn't started poking around.
No-one was troubled by 30 minutes elapsed time to backup a database that is over 1 TB in size - not even me. But, for an online backup, I'm averse to accepting high read latency. Read latency was often above 4 full seconds! I'm not a fan of such long waits. After graphing the activity as above, I was convinced the backup could be improved.
Back in the lab I convinced another performance engineer that this would be a worthwhile endeavor. (I get so many crazy ideas I have to show that some of them are worth testing time :) ) We didn't replicate the original system where the high latencies were observed - the goal was more basic, general backup tuning for the type of systems we normally work with. We used "dbcc traceon (3605, 3213, -1)" to store details about the backup execution in the SQL Server error log. The storage in our test system was presented from an EMC VNX, using 60 large form factor 15k disks in a virtual pool - so 12 RAID 5 4+1s. The backup source database was over 2 TB, with 24 equally sized row data files, each the sole resident of their own LUN (Windows mounted volumes rather than drive letters, just because we'd run out of letters). 12 of these LUNs were on each of the VNX storage controllers for balance. A single LUN contained all of the backup target files for each of the test executions. (From the start I believed that using two backup target LUNs, one on each storage processor, would be more beneficial due to balancing write cache needs - but I'll have to wait for another day soon to test that theory.)
When I think about optimizing online backups, there are three separate planes of optimization I have in mind:
1. Elapsed time. Everyone thinks of that one.
2. Read and write latency experienced by the SQL Server host. Its an online backup, right? Don't punish the users.
3. Latency effects on other tenants of the SAN. I put in lots of work to make systems "good neighbors".
So, what are the tunable knobs for turning? SQL Server T-SQL backup command allows overriding default behavior by supplying values for MAXTRANSFERSIZE and BUFFERCOUNT parameters. And the number of target files can easily be varied.
We started with MSSQL backup MAXTRANSFERSIZE at the default 1 mb. We were using perfmon to monitor at the Windows level, and Unisphere to monitor SAN activity on the VNX. Default MAXTRANSFERSIZE notwithstanding, the VNX said all write activity was coming in at 512kb. Hmm. Again... maybe most folks wouldn't complain. Between the reads and writes, more than 1 GB of data per second is being moved. And other than a singular peak, latency is kept well below 30 ms. Its actually much better than the original graph - far lower latency and higher throughput. But I'm not easily satisfied.
I've worked with IBM Power servers running AIX much longer than Windows servers. By default, the AIX maximum transfer size for individual physical volumes is 256kb. For the AIX Oracle servers I work with, I recommend increasing physical volume max transfer to at least 1mb, and fibre channel adapter max transfer to at least 2 mb. Lots of specific reasons for that Oracle on AIX config can be discussed elsewhere, but ultimately I want these systems to move as little data as necessary for their workload, with as many 1 mb transfers as possible. So in AIX, gotta make sure that the physical volume and the fibre channel adapter will both ALLOW 1 mb transfers.
The 256 kb default max transfer size for AIX physical volumes had me thinking that the HBA on the SQL Server might have a 512 kb maximum transfer size - so that SQL Server's 1 mb backup IOs were being split into individual 512 kb operations by the HBA driver.
Should have been easy enough to investigate. But it wasn't. We had a QLogic HBA on the server. Thought maybe installing SanSurfer would allow us to see and set the HBA maximum transfer size. Not necessarily :) Its possible to have the HBA and driver installed and operating without error, and to install Sansurfer... but still not have the necessary components to check and set the maximum transfer size! Specifically, you'll need qlfc.exe or qlfcx64.exe to get or set the maximum transfer size.
You can find "Fibre Channel STOR Miniport 64-bit Driver for Windows 2008 (x64)" download packages here, check the readme package contents to make sure the qlfc executable you need is included.
http://driverdownloads.qlogic.com/QLogicDriverDownloads_UI/SearchProductPreviousRelease.aspx?ProductCategory=39&Product=1044&Os=173&ResourceCategory=Drivers&grid=1
My favorite resource for using qlfc from the command line:
http://adminhelpline.blogspot.com/2012_07_01_archive.html
After installing the component, I retrieved the maximum transfer size with this command:
Sure enough. 512 kb default maximum transfer size. With driver version 9.1.8.28 or later, max transfer size can be set up to 2048 kb or 2 mb with this utility:
The change requires a reboot to become effective.
So on the test system, since the Windows volumes were based on Virtual Provisioning, the default write-aside was in place: writes larger than 1 mb would bypass SAN cache and writes 1 mb or less would go to write cache. Here's the test results: 4 target files, 1 mb SQL Server max transfer, 2 mb HBA max transfer.
qlfcx64.exe -tsize /fc /set 2048
Then we returned to testing. Its important to note that on the VNX, like the CLARiiON before it, there is a 'configurable' write-aside value: a write size threshold beyond which the write bypasses SAN cache. The write-aside is specified in 512 byte blocks. The default value is 2048, or 1 mb. For traditional LUNs, the write-aside can be set to a nondefault. However, "Caching and prefetching for Virtual Provisioning-based storage cannot be changed." page 16
http://www.emc.com/collateral/hardware/white-papers/h5773-clariion-best-practices-performance-availability-wp.pdf

So, increasing the HBA max transfer size to 2 mb and using the default 1 mb maximum transfer size for the SQL Server backup allows each read and write to not be split up by the HBA driver. And all of the writes go to write cache. (Although writing to SAN cache makes the backup operation faster overall and mutes the impact of the writes on reads, on some systems the backup writes may saturate write cache. Write cache saturation can cause performance degradation both for the source SQL Server instance and other tenants of the SAN. In such cases, it will be best to use a 2 mb or 4mb SQL Server maximum transfer size to bypass the write cache, and an HBA max transfer size equal or greater than the SQL Server transfer size.) Throughput has increased, and latency has dropped! Amazing, huh?
Write latency now peaks under 25 ms, and read latency stays under 15 ms for the duration of the backup. I think it can still get better. I'm looking to make throughput stay steady right around 1600 megabytes/second - about the maximum throughput the system will allow. Now that the HBA isn't chopping up reads and writes before passing them on... its time to increase the number of files again. Here's what happened at 6 files, default 1 mb SQL Server max transfer, 2 mb HBA max transfer.

Wow! That's the best yet! Throughput went up again, the read and write latencies inched up again, but the total elapsed time for the backup dropped again. I'll come back for another round of tuning in a while... this last round of testing, especially the two write latency spikes above 30 ms, makes me think that using two backup target LUNs, one on each controller in order to balance write cache usage, will be the best route to go. It'll be awhile before I get to play with this system again, though.
So... how is it that these changes could increase throughput AND decrease latency from the original? Here's a secret: don't fill your disk I/O queues. Don't fill them at the Windows volume level, don't fill the I/O queue for the HBA, don't fill the SAN port queue, don't fill the queue within the SAN for its internal LUN/logical device. When an IO queue is filled, throttling takes place. That just increases your IO wait time. If combining smaller sequential reads and writes into larger operations helps you get from an overflowing IO queue to a busy but sufficient IO queue... database users will notice the difference.
If you want to test this or other backup tuning strategies, take a look at this method for automating your testing/tuning.
http://sirsql.net/blog/2012/12/12/automated-backup-tuning
Ciao until I come back for more adventure in SQL Server backups... heh, maybe no-one else is talking about HBA max transfer and SQL Server. But I'll tell you what: its a whole lot cheaper to make sure that what you already have in place is optimally configured than it is to go out and start buying new stuff which may also never get fully tuned :)
http://msdn.microsoft.com/en-us/library/ms186865.aspx
Below is a graph from perfmon numbers collected in 15 second intervals. Don't laugh - it takes me forever to make graphs that look this cheesy :)
The primary vertical axis on the left is measured in seconds, for the average read latency (blue) and average write latency (red). Secondary vertical axis on the right is measured in megabytes per second, for the sum of read and write throughput.
The horizontal axis is a count of the 15 second intervals elapsed during the monitored activity.
This system has a simple recovery mode, multi-file database being backed up, using SQL Server backup compression. Eight equally sized LUNs each host a single MSSQL database row file. A single backup target LUN has lots and lots of backup target files. The read and write latencies, and the throughput graphed below are aggregates across those 8 database file and single backup target LUNs.

Migrating the system to a new server and new storage is a great time to recalibrate SQL Server backup. However, the backup was faster on the new system out of the box than on the older system - it seemed good enough so wasn't recalibrated. Maybe that's the way things would have stayed, too, if I hadn't started poking around.
No-one was troubled by 30 minutes elapsed time to backup a database that is over 1 TB in size - not even me. But, for an online backup, I'm averse to accepting high read latency. Read latency was often above 4 full seconds! I'm not a fan of such long waits. After graphing the activity as above, I was convinced the backup could be improved.
Back in the lab I convinced another performance engineer that this would be a worthwhile endeavor. (I get so many crazy ideas I have to show that some of them are worth testing time :) ) We didn't replicate the original system where the high latencies were observed - the goal was more basic, general backup tuning for the type of systems we normally work with. We used "dbcc traceon (3605, 3213, -1)" to store details about the backup execution in the SQL Server error log. The storage in our test system was presented from an EMC VNX, using 60 large form factor 15k disks in a virtual pool - so 12 RAID 5 4+1s. The backup source database was over 2 TB, with 24 equally sized row data files, each the sole resident of their own LUN (Windows mounted volumes rather than drive letters, just because we'd run out of letters). 12 of these LUNs were on each of the VNX storage controllers for balance. A single LUN contained all of the backup target files for each of the test executions. (From the start I believed that using two backup target LUNs, one on each storage processor, would be more beneficial due to balancing write cache needs - but I'll have to wait for another day soon to test that theory.)
When I think about optimizing online backups, there are three separate planes of optimization I have in mind:
1. Elapsed time. Everyone thinks of that one.
2. Read and write latency experienced by the SQL Server host. Its an online backup, right? Don't punish the users.
3. Latency effects on other tenants of the SAN. I put in lots of work to make systems "good neighbors".
So, what are the tunable knobs for turning? SQL Server T-SQL backup command allows overriding default behavior by supplying values for MAXTRANSFERSIZE and BUFFERCOUNT parameters. And the number of target files can easily be varied.
We started with MSSQL backup MAXTRANSFERSIZE at the default 1 mb. We were using perfmon to monitor at the Windows level, and Unisphere to monitor SAN activity on the VNX. Default MAXTRANSFERSIZE notwithstanding, the VNX said all write activity was coming in at 512kb. Hmm. Again... maybe most folks wouldn't complain. Between the reads and writes, more than 1 GB of data per second is being moved. And other than a singular peak, latency is kept well below 30 ms. Its actually much better than the original graph - far lower latency and higher throughput. But I'm not easily satisfied.
The 256 kb default max transfer size for AIX physical volumes had me thinking that the HBA on the SQL Server might have a 512 kb maximum transfer size - so that SQL Server's 1 mb backup IOs were being split into individual 512 kb operations by the HBA driver.
Should have been easy enough to investigate. But it wasn't. We had a QLogic HBA on the server. Thought maybe installing SanSurfer would allow us to see and set the HBA maximum transfer size. Not necessarily :) Its possible to have the HBA and driver installed and operating without error, and to install Sansurfer... but still not have the necessary components to check and set the maximum transfer size! Specifically, you'll need qlfc.exe or qlfcx64.exe to get or set the maximum transfer size.
You can find "Fibre Channel STOR Miniport 64-bit Driver for Windows 2008 (x64)" download packages here, check the readme package contents to make sure the qlfc executable you need is included.
http://driverdownloads.qlogic.com/QLogicDriverDownloads_UI/SearchProductPreviousRelease.aspx?ProductCategory=39&Product=1044&Os=173&ResourceCategory=Drivers&grid=1
My favorite resource for using qlfc from the command line:
http://adminhelpline.blogspot.com/2012_07_01_archive.html
After installing the component, I retrieved the maximum transfer size with this command:
qlfcx64.exe -tsize /fc
Sure enough. 512 kb default maximum transfer size. With driver version 9.1.8.28 or later, max transfer size can be set up to 2048 kb or 2 mb with this utility:
The change requires a reboot to become effective.
So on the test system, since the Windows volumes were based on Virtual Provisioning, the default write-aside was in place: writes larger than 1 mb would bypass SAN cache and writes 1 mb or less would go to write cache. Here's the test results: 4 target files, 1 mb SQL Server max transfer, 2 mb HBA max transfer.
qlfcx64.exe -tsize /fc /set 2048
Then we returned to testing. Its important to note that on the VNX, like the CLARiiON before it, there is a 'configurable' write-aside value: a write size threshold beyond which the write bypasses SAN cache. The write-aside is specified in 512 byte blocks. The default value is 2048, or 1 mb. For traditional LUNs, the write-aside can be set to a nondefault. However, "Caching and prefetching for Virtual Provisioning-based storage cannot be changed." page 16
http://www.emc.com/collateral/hardware/white-papers/h5773-clariion-best-practices-performance-availability-wp.pdf
So, increasing the HBA max transfer size to 2 mb and using the default 1 mb maximum transfer size for the SQL Server backup allows each read and write to not be split up by the HBA driver. And all of the writes go to write cache. (Although writing to SAN cache makes the backup operation faster overall and mutes the impact of the writes on reads, on some systems the backup writes may saturate write cache. Write cache saturation can cause performance degradation both for the source SQL Server instance and other tenants of the SAN. In such cases, it will be best to use a 2 mb or 4mb SQL Server maximum transfer size to bypass the write cache, and an HBA max transfer size equal or greater than the SQL Server transfer size.) Throughput has increased, and latency has dropped! Amazing, huh?
Write latency now peaks under 25 ms, and read latency stays under 15 ms for the duration of the backup. I think it can still get better. I'm looking to make throughput stay steady right around 1600 megabytes/second - about the maximum throughput the system will allow. Now that the HBA isn't chopping up reads and writes before passing them on... its time to increase the number of files again. Here's what happened at 6 files, default 1 mb SQL Server max transfer, 2 mb HBA max transfer.
Wow! That's the best yet! Throughput went up again, the read and write latencies inched up again, but the total elapsed time for the backup dropped again. I'll come back for another round of tuning in a while... this last round of testing, especially the two write latency spikes above 30 ms, makes me think that using two backup target LUNs, one on each controller in order to balance write cache usage, will be the best route to go. It'll be awhile before I get to play with this system again, though.
So... how is it that these changes could increase throughput AND decrease latency from the original? Here's a secret: don't fill your disk I/O queues. Don't fill them at the Windows volume level, don't fill the I/O queue for the HBA, don't fill the SAN port queue, don't fill the queue within the SAN for its internal LUN/logical device. When an IO queue is filled, throttling takes place. That just increases your IO wait time. If combining smaller sequential reads and writes into larger operations helps you get from an overflowing IO queue to a busy but sufficient IO queue... database users will notice the difference.
If you want to test this or other backup tuning strategies, take a look at this method for automating your testing/tuning.
http://sirsql.net/blog/2012/12/12/automated-backup-tuning
Monday, July 22, 2013
IBMPower AIX Hotspot hunting - lvmstat
So, maybe you think there are hotspots in disk IO queuing. I often think that when looking at #Oracle 11GR2 on #AIX #IBMPower servers. The lvmstat command can be your best friend in tracking down host side LVM hotspots. Believe me, sometimes you can get a big benefit by moving a small amount of data. But, usually you end up proving some known best practices - like keeping Oracle redo logs on separate logical and physical volumes from Oracle database .dbf files, and keeping ETL flat files on separate logical/physical volumes from both redo logs and dbf database files :)
At any rate, lvmstat is a mega-useful tool. A few references for your reading enjoyment.
http://pic.dhe.ibm.com/infocenter/aix/v6r1/topic/com.ibm.aix.prftungd/doc/prftungd/lvm_perf_mon_lvmstat.htm
http://poweritpro.com/performance/if-your-disks-are-busy-call-lvmstat
Root privileges are required for lvmstat, and unlike iostat there isn't a parameter to timestamp its output. Easily remedied with awk.
Here's some iostat info from mountainhome, a server chosen totally at random. :)
# iostat -DlRTV hdisk0
System configuration: lcpu=24 drives=6 paths=10 vdisks=2
Disks: xfers read write queue time
-------------- -------------------------------- ------------------------------------ ------------------------------------ -------------------------------------- ---------
%tm bps tps bread bwrtn rps avg min max time fail wps avg min max time fail avg min max avg avg serv
act serv serv serv outs serv serv serv outs time time time wqsz sqsz qfull
hdisk0 0.6 44.3K 6.3 11.7K 32.6K 2.5 5.3 0.1 215.6 0 0 3.8 1.8 0.2 165.3 0 0 11.8 0.0 130.5 0.0 0.0 2.8 12:10:08
My eagle-sharp eyes train in on the serv qfull number - a rate of 2.8 per second for the monitoring period! Time for intervention! At least for me - I hate qfulls.
Lets try to be scientifical about this.
Enable the volume groups/logical volumes for stats collection.
A script I've got for that - ain't pretty but it works. (execute as root)
#enable lvmstat stats
for vg in `lsvg | /usr/bin/awk -u '{print $1 ;}'`;
do
lvmstat -v $vg -e
for lv in `lsvg -l $vg | /usr/bin/awk -u 'NR <= 2 { next } {print $1 ;}'`;
do
lvmstat -l $lv -e ;
done ;
done ;
Once stats are enabled for the volume groups/logical volumes that you care about... start collecting! (execute as root)
./sasquatch_lvmstat_script 3 3 $(pwd) 4 &
#sasquatch_lvmstat_script
# Begin Functions
lvmon_cmd(){
/usr/sbin/lvmstat -s -l $1 -c$2 $3 $4 | /usr/bin/awk -u '{print $0, date}' date="`date '+%D %H:%M:%S'`" >> $5/$(hostname)_$6_$1_$(date +%Y%m%d)
}
# End functions
interval=${1:-2}
count=${2:-2}
logdir=${3:-/tmp}
top=${4:-32}
for vg in `lsvg | /usr/bin/awk -u '{print $1 ;}'`;
do
for lv in `lsvg -l $vg | /usr/bin/awk -u 'NR <= 2 { next } {print $1 ;}'`;
do
lvmon_cmd $lv $top $interval $count $logdir $vg $lv &
done ;
done ;
Lets pretend I've looked at enough of the output files to determine that lvmcore is the heavy hitter logical volume in rootvg.
The output files from the lvmstat script look kinda like this:
cat mountainhome_rootvg_lvcore_20130722
07/22/13 11:42:47
Log_part mirror# iocnt Kb_read Kb_wrtn Kbps 07/22/13 11:42:47
56 1 53 212 0 0.00 07/22/13 11:42:47
1 1 52 208 0 0.00 07/22/13 11:42:47
53 1 10 40 0 0.00 07/22/13 11:42:47
2 1 7 28 0 0.00 07/22/13 11:42:47
.. 07/22/13 11:42:47
Log_part are the logical partitions of the logical volume. Match them up to physical partitions and physical volumes based on the output of something like 'lslv -m'.
# lslv -m lvcore | grep -e 0056 -e 0053 -e 0001 -e 0002
0001 0704 hdisk0
0002 0705 hdisk0
0053 0756 hdisk0
0056 0759 hdisk0
So... what are the lines with nothing but periods and a timestamp? Those are quiet collection intervals - lvmstat collapsed them for you. That was nice! Kinda like including -V in iostat -DlRTV you only get what you need.
OK. So Logical partitions 0056 and 0001 are the busiest in logical volume lvcore. They are both on hdisk0. And we supposedly compared the output across our logical volumes in rootvg and saw that, while hdisk0 is under qfull pressure, lvmcore is the heavy hitter in rootvg volume group. If there's a quiet hdisk in rootvg, moving one of those logical partitions - or both of them... could relieve the pressure. Or, maybe you know the contents. (The fileplace command can assist by mapping individual file fragments to logical partitions of the logical volume - that's a lesson for another day.) Sometimes its easiest to say "golly! I guess I could put such-n-such into a different filesystem on a different volume group! It wouldn't put any pressure on filesystem buffers or any pressure on those physical volume IO queues then!" That kinda stuff requires negotiation, though. And I'm not a negotiator, just a sasquatch.
When you are done with lvmstat monitoring, disable the stats collection. Its a small amount of overhead, but if you aren't baselining or investigating... no need to have the stats enabled. (execute as root)
#disable lvmstat stats
for vg in `lsvg | /usr/bin/awk -u '{print $1 ;}'`;
do
/usr/sbin/lvmstat -v $vg -d
for lv in `lsvg -l $vg | /usr/bin/awk -u 'NR <= 2 { next } {print $1 ;}'`;
do
/usr/sbin/lvmstat -l $lv -d ;
done ;
done ;
Friday, July 19, 2013
Emulex LUN/FibreChannel Adapter and LUN queue full events in Linux
IBM AIX makes it pretty easy to monitor fibre channel LUNs and fibre channel adapters for queue full conditions. I used to think it would be just as easy to monitor on Windows and on Linux. Sigh.
In AIX, I use "iostat -DlRTV" all the time, and my first stop is "serv qfull" (second to last, right next to the timestamp). If I see that number increasing during my time of interest, I have a pretty good idea of what to do. (Ideally there will be no LUN or adapter queue fulls at all on the system.)
I also use AIX fcstat all the time. The output is in list format, and each adapter has to be specified in the command. I posted an awk command I use to flatten the output into csv format when I run fcstat unattended. But... fcstat makes it doggone easy to see when the adapter queue depth is overrun. Its right there in "No Adapter Elements Count". If I see that number increasing during my time of interest, I have a pretty good idea of what to do.
Then we get to Windows. I don't even KNOW what I'll do there. Criminey! It took hours to get the right utilities to increase the max transfer size on Windows... I'm too scared to even THINK about monitoring for LUN or adapter queue fulls right now.
OK... now Linux. Oracle is pushing Linux HARD, what with Exadata and their own Unbreakable/Oracle Enterprise Linux distro. So I expected Linux to be pretty mature in the area of disk IO queuing transparency. I'm disappointed. Really disappointed.
The Linux implementation of iostat will give an average queue length per LUN. That's not what I want. Full disk IO queues can hide real easily in average queue depth, even in 15 second intervals.
There isn't a standard replacement for fcstat in Linux. Dang it! Okay. That leaves HBA level and multipather level. But its the HBA that I'm really worried about throttling Linux disk IO. So that's where I'll go.
Start with Emulex. Move on to QLogic when I recover.
Emulex Driver for Linux
FC and FCoE version 8.2.0.63
NIC version 2.101.374.0
iSCSI version 2.101.374.0
User Manual
http://www-dl.emulex.com/support/linux/uldk/10014/linux.pdf
Here's the thing - even when you grab "statistics" from Emulex, it seems that queue full occurrences aren't deemed important enough to include in statistics. Really? OK. On to error and even logging.
elx_mes0318: Failed to allocate IOTAG. last IOTAG is <last_allocated_iotag>
That's what I am talking about. Running out of command tags for disk IO is important enough that the driver always logs it to /var/log/messages.
What about other queue full conditions? Like these:
elx_mes0707: Driver's buffer pool is empty, IO busied
LOG_FCP verbose
elx_mes0708: Allocation request of <num_to_alloc> command buffers did not succeed. Allocated <num_allocated> buffers.
LOG_FCP verbose
elx_mes0711: Detected queue full - lun queue depth adjusted to %d
LOG_FCP verbose
The "LOG_FCP verbose" classification means that unless the hex bitmask value for lpfc_log_verbose includes the value for LOG_FCP, you won't see the messages. Guess what? The guide doesn't tell you what the LOG_FCP value is, so it can be included in lpfc_log_verbose.
Gotta look around. Eventually in a couple of HP support documents I found what I was looking for. So, when I do targeted performance investigation on Linux, I'll be including LOG_FCP = 0x40 in lpfc_log_verbose, and I'll take it back out when I'm done. Because I think this stuff is important. And I think there are probably lots of systems getting hit by queuing issues... and not necessarily aware of it.
#lpfc_log_verbose to capture Emulex queue full info per http://h10025.www1.hp.com/ewfrf/wc/document?cc=us&lc=en&dlc=en&docname=c02071793
#LOG_FCP=0x40 per
#http://h30507.www3.hp.com/t5/Technical-Support-Services-Blog/Enable-verbose-debugging-with-Emulex-and-Qlogic-on-Linux/ba-p/89957#.Uem9fY2W-So
echo 0x40 > /sys/class/scsi_host/host[X]/lpfc_log_verbose
That should allow me to look for the following messages in /var/log/messages:
elx_mes0318: Failed to allocate IOTAG. last IOTAG is <last_allocated_iotag>
Always
elx_mes0707: Driver's buffer pool is empty, IO busied
LOG_FCP verbose
elx_mes0708: Allocation request of <num_to_alloc> command buffers did not succeed. Allocated <num_allocated> buffers.
LOG_FCP verbose
elx_mes0711: Detected queue full - lun queue depth adjusted to %d
LOG_FCP verbose
We'll see how that goes.
*********
Ohhh...
http://h30507.www3.hp.com/t5/Technical-Support-Services-Blog/Enable-verbose-debugging-with-Emulex-and-Qlogic-on-Linux/ba-p/89957#.Uem9fY2W-So
WARNING:
Depending on the LPFC driver, the logging level definitions may differ... Always check ./lpfc_attr.c for latest table
Friday, July 5, 2013
SQL Server index and stats maintenance - per object or per table?
Today Jonathan Lewis put up a blog post that got me thinking.
http://jonathanlewis.wordpress.com/2013/07/05/wrong-index/
The databases I spend my time thinking about are getting bigger and bigger all the time. There's just not enough time in a day to do maintenance that doesn't give a return.
So don't rebuild/reorg an index if updating the stats will do, and don't do any of it unless the profile of the table and related queries indicates it will matter.
In SQL Server 2014 it looks like I'll be able to make the decision and take action partition by partition. Excellent! But until then... when time starts getting tight on an individual system... what is the smallest unit on which to take action?
What are the conditions under which it would make sense to rebuild nonClustered index A from table B on Monday (along with some other stuff), and reorg NC index C from table B on Wednesday (along with some other stuff)... instead of planning a time to act on the entire table at once?
It seems to me to be a better plan, for now, to keep acting on whole tables at a time... and plan for the future with per-partition actions. I don't think I want the variability that could come with one defragged/updated object in a table while other objects are more fragmented/stale.
Tuesday, July 2, 2013
Pending query memory grant requests; Resource Governor to increase query concurrency
Today while reviewing information from sys.dm_exec_query_memory_grants I noticed information for a query that listed ideal memory 278622251861496 - many petabytes. The query cost was 42431012814. Historically, SQL Server query cost was tied to an estimate of query execution time on a particular system. Good thing that query wasn't running on that system - the cost estimate is for 1,345 years of execution time. :) That query wasn't alone - there were lots of queries that submitted excessive query memory grants. And there were lots of pending query memory grants. CPU utilization on the server was low - a brief peak at approximately 60% CPU busy was as high as it reached. For much of the time, more pending query memory grants were registered than outstanding grants. In order to improve performance, we had to get queries to stop just standing around.
The following is from the followup email I sent after discussing perfmon metrics and metrics from sys.dm_exec_query_memory_grants dmv on a conference call.
****
This afternoon we looked at perfmon metrics and sys.dm_exec_query_memory_grants information indicating extended periods of low server CPU utilized, few outstanding query memory grants (as low as three) together with many pending query memory grants (sometimes approaching 100 pending grants).
Some queries on the system currently have such large query cost and "ideal memory" (the sum of the required memory for the plan operators and the estimated intermediate and final query results) that increasing the server RAM would simply increase the query grant requests these queries would make.
Large query memory grant requests might actually be used by the requesting queries. However, often large query memory grant requests are examples of "eyes bigger than stomach". In these cases, the query only uses a small portion of the large query memory grant request.
Buffer pool pages are stolen as needed for query memory as the query progresses, up to the amount of the query memory grant. "Reserved memory" accounts for the portion of query memory grants that have not yet been stolen. Subtracting the reserved memory from the granted workspace memory yields the pages stolen for query memory. This number is less than the number of stolen pages indicated by perfmon, because pages are also stolen for uses other than query workspace. (The number of stolen pages while there are 0 outstanding query memory grants fluctuates a bit, but gives a pretty good idea of the number of stolen pages used for other purposes.) The ratio of reserved memory to granted query workspace memory is consistently very high when there are pending query memory grants - never lower than 88% - indicating a low likelihood that most of the granted memory will ever be stolen for query memory.
There are two options for decreasing pending query memory grants and increasing query concurrency in that context:
1. Identifying and tuning problem queries to reduce maximum query memory grant request size.
2. Using Resource Governor to reduce REQUEST_MAX_MEMORY_GRANT_PERCENT. If this option is used, it should be a stopgap solution to allow additional time for identifying and tuning problem queries. Once the offending queries have been corrected, REQUEST_MAX_MEMORY_GRANT_PERCENT should return to its default value.
The Resource Governor default MAX_MEMORY_PERCENT value for the default workgroup is the same as the SQLServer:Memory Manager\Maximum Workspace Memory perfmon metric. The Resource Governor REQUEST_MAX_MEMORY_GRANT_PERCENT value, the largest allowed individual query memory grant request, is by default 25% of MAX_MEMORY_PERCENT.
In this case, lowering the REQUEST_MAX_MEMORY_GRANT_PERCENT to 5% would allow 19 or 20 (depending on other consumption of stolen pages) concurrent queries to execute with the maximum allowed query memory grant.
Any reduction of REQUEST_MAX_MEMORY_GRANT_PERCENT should be accompanied by monitoring of the use of query memory grants and tempdb; queries will spill remaining results to tempdb if they have already exhausted their query memory grant and haven't completed. The idea of reducing REQUEST_MAX_MEMORY_GRANT_PERCENT is to increase query concurrency without causing excessive spills to tempdb by "right-sizing" query memory grant requests.
The following link hints at this type of intervention.
http://technet.microsoft.com/en-us/library/cc627395(v=sql.105).aspx
From this page:
"… increasing request_max_memory_grant_percent has a side effect of reducing concurrency of large queries. For example, users can expect to run three large queries with the default 25 percent setting, but only two large queries with a 40 percent setting."
Conversely, reducing request_max_memory_grant_percent has a side effect of increasing concurrency of queries with large ideal memory estimates.
Subscribe to:
Posts (Atom)