Saturday, September 30, 2017

SQL Server - estimates outside of the histogram - half-baked draft

Gonna pull together lots of stuff about cardinality estimates outside of the stats histogram here.  It'll take me a while...
 
SQL Server keeps track of how many inserts and deletes since last stats update – when the number of inserts/deletes exceeds the stats update threshold the next time a query requests those stats it’ll qualify for an update.  Trace flag 2371 alters the threshold function before SQL Server 2016. With 2016 compatibility mode, the T2371 function becomes default behavior.  Auto-stats update and auto-stats update async settings of the database determine what happens once the stats qualify for an update.  But whether an auto-stats update or a manual stats update, the density, histogram, etc are all updated.

Trace flags 2389, 2390, 4139, and the ENABLE_HIST_AMENDMENT_FOR_ASC_KEYS hint operate outside the full stats framework, bringing in the quickstats update.  They have slightly different scope in terms of which stats qualify for quickstats updates – but in each case its *only* stats for indexes, not stats for non-indexed columns that can qualify.  After 3 consecutive stats updates on an index, SQL Server “brands” the stats type as ascending or static, until then it is branded ‘unknown’. The brand of a stat can be seen by setting trace flag 2388 at the session level and using dbcc show_statistics.

T2389 – Introduced in SQL Server 2005 SP1. quickstats update for stats branded ‘ascending’.  Finds just the current max value, and density together with max value is used for estimate outside of histogram range.  Histogram itself is not persistently amended.
T2390 – Introduced in SQL Server 2005 SP1. quickstats update for stats branded ‘unknown’.  Finds current max value for stats branded ‘unknown’, as above.
T4139 – First available in SQL Server 2012 & 2014, released in the CU stream for each.  A significant gap left with T2389 and T2390 is a case where an index stat has been branded ‘static’ based on its update pattern, even though over the longterm trend the highest value is ascending.  In fact, if more than 10% of the edits to an index between stats updates are *within* the histogram range rather than 90%+ above the histogram range, it may be marked as static.  So, with trace flag 4139 an index can qualify for a quickstats update regardless of its brand.  Trace flag 4139 supersedes and exceeds T2389 & T2390 in that manner.  
ENABLE_HIST_AMENDMENT_FOR_ASC_KEYS – This hint was introduced in SQL Server 2016 SP1.  It functions as trace flag 4139 does, but it can only be applied at the query level while trace flag 4139 can be enabled globally.

There are additional details, such as which indexes types are disqualified from quickstats updates, and when and how the new CE handles ascending keys and/or responds to the trace flags and hint.  But this might already be more than you wanted

https://support.microsoft.com/af-za/help/922063/fix-you-may-notice-a-large-increase-in-compile-time-when-you-enable-tr

Tuesday, September 26, 2017

#SQLServer Just How Minimal Can That Problem Repro Get? Bit Column + outdated stats + histogram amendment

***** Update 2019/0408 *****
Wanted to point out that the kb4316948 fix for histogram amendments (quickstats) is now available in SQL Server 2016 SP2 CU5 as well as SQL Server 2017 CU8.
***** End Update *****
 
***** Update 2018/0713 *****

The Connect item link below is, of course, dead now.  No matter.  Because this issue was fixed in SQL Server 2017 CU8 by this kb.

FIX: Access violation when you compile a query and histogram amendment is enabled with default Cardinality Estimation in SQL Server 2017
https://support.microsoft.com/en-gb/help/4316948/fix-access-violation-when-you-compile-a-query-and-histogram-amendment 

***** End Update *****

Often among the hardest of my decisions is whether I should spend more time trying to simplify a given problem by eliminating additional factors, shrinking the data needed for a repro, etc... or just put all that effort into investigation purely aimed at understanding the behavior. I expect that to be a long-term challenge :-)

I was quite happy with the way this particular one worked out, though. It started as a maze... access violations generated on a SQL Server 2016 instance with dozens of databases. The access violation came from an insert query using a synonym - with the underlying table in another database! (I didn't know that was possible - or *ever* desirable - until I saw it in this context.) The AV was occurring during a multi-step data transfer process and it was hard to isolate the data flowing into and out of the two databases in question. But after some finagling, I got the problem repro pretty doggone small. Reproduced the AVs on several CUs of SQL Server 2016 and on SQL Server 2017 RC2.

Let me offer a disclaimer before the code to produce the AV. I don't *think* this will do any persistent harm other than a terminated session and dumps like these below.  Regardless, if you choose to reproduce the access violation, please only do so on a nonproduction system.  The dump the AV created on my SQL Server 2017 system...


Here's the setup.  Two 2-column tables in tempdb.  One of those tables with a single row.  The other table with 1 row - then stats auto-created - then a second row inserted.

-- error reproduced on SQL Server 2016 SP1-CU2, SP1-CU3, SP1-CU4
SELECT @@version    -- SQL Server 2017 RC2
SET NOCOUNT ON
USE tempdb;


DROP TABLE IF EXISTS #temp;
SELECT 1 AS key1, 1 AS key2 
INTO #temp;


DROP TABLE IF EXISTS #temp2;
SELECT CONVERT(INT, 1) AS key1, CONVERT(BIT, 0) as deleted 
INTO #temp2

-- auto create stats while only 1 row
SELECT * FROM #temp2 where deleted = CONVERT(BIT, 0); 
INSERT INTO #temp2 -- add a 2nd row with *different* value for key1
SELECT CONVERT(INT, 2), CONVERT(BIT, 0);

So that's the setup.

After the setup, the offending query is quite simple.


-- New CE (via T2312 or default) plus (T4139 or ENABLE_HIST_AMENDMENT_FOR_ASC_KEYS) produces an Access Violation
SELECT #temp.key2
FROM #temp 
INNER JOIN #temp2 ON #temp.key1 = #temp2.key1
GROUP BY #temp.key2
HAVING MIN(CAST(#temp2.Deleted AS INT)) = 1
OPTION (USE HINT('ENABLE_HIST_AMENDMENT_FOR_ASC_KEYS'), QUERYTRACEON 2312);

And the result...


Ouch.  That looks really painful.

An interesting sidenote: in the not-too-distant past, histogram amendments via trace flags 2389, 2390 and/or 4139 seemed to have been exclusively the realm of the legacy cardinality estimater.  This Access Violation is a strong indication that is no longer the case.

Filed a Connect item for this.  Fortunately, the workflow and data involved in this were amenable to a schema change to no longer use a column of type bit - allowed side-stepping this error for now.

SQL Server 2017 Access Violation - outdated bit column stats and histogram amendments
https://connect.microsoft.com/SQLServer/feedback/details/3141605

SQL Server - formerly dirty data page still in bpool after checkpoint?

@Kevin3NF asked the question, and @NedOtter added the important clarification that my answer is for the context of on-disk rowstore, since Hekaton tables are outside of the bpool thus bpool dirty pages don't apply.

*****

A question came up on Twitter #\sqlhelp that caught my eye today.

Paraphrasing: After a checkpoint writes a dirty database page, does that page remain in the buffer pool as a clean page?

I thought the answer was yes, but figured I better check :-)

My test code...

SELECT @@version AS sqlServer_version;
DROP TABLE IF EXISTS sasq_Test_checkpoint;
SELECT convert(int, 1) num INTO sasq_Test_checkpoint;

SELECT db_name(bd.database_id) dbName, bd.file_id, object_name(sp.object_id) o_name, bd.page_id, bd.page_level, bd.page_type, au.[type_desc], bd.is_modified 
FROM sys.dm_os_buffer_descriptors bd
JOIN sys.allocation_units au ON bd.allocation_unit_id = au.allocation_unit_id 
JOIN sys.partitions sp ON au.container_id = CASE WHEN au.[type_desc] IN ('IN_ROW_DATA', 'ROW_OVERFLOW_DATA') THEN sp.hobt_id ELSE sp.partition_id END
WHERE bd.database_id = db_id()
AND sp.object_id = object_id('sasq_Test_checkpoint'); 

CHECKPOINT;

SELECT db_name(bd.database_id) dbName, bd.file_id, object_name(sp.object_id) o_name, bd.page_id, bd.page_level, bd.page_type, au.[type_desc], bd.is_modified 
FROM sys.dm_os_buffer_descriptors bd
JOIN sys.allocation_units au ON bd.allocation_unit_id = au.allocation_unit_id 
JOIN sys.partitions sp ON au.container_id = CASE WHEN au.[type_desc] IN ('IN_ROW_DATA', 'ROW_OVERFLOW_DATA') THEN sp.hobt_id ELSE sp.partition_id END
WHERE bd.database_id = db_id()
AND sp.object_id = object_id('sasq_Test_checkpoint');


And... the results...

Good, I got that one right :-)

Ciao for now!

Thursday, September 21, 2017

SQL Server - exploring hash distribution of rows to threads in Parallel Queries Part I

*****

If intrigued by this idea of determining which parallel query thread thread at a given DOP a value or values will be assigned to by hash partitioning, please also see this post by Joe Obbish.

A Serial Parallel Query
https://orderbyselectnull.com/2017/09/26/a-serial-parallel-query/

*****


The SQL below will create a table with 2^(n-1) rows with num value n, for each integer n between 1 and 16.  The total number of rows in the table is 2^15 - 1 or 65535.

This first draft code isn't elegant or very efficient.  It took 8 minutes and 11 seconds to complete on the test vm.  But a table with this structure should be very valuable in experiments to learn about hash distribution of rows among parallel threads.  Originally I though it might also lead to leaning a bit about how the parallel page supplier works. (Not so much.)

DROP TABLE IF EXISTS lnieders_bitmap;
CREATE TABLE lnieders_bitmap(num INT, fluff VARCHAR(4100));
CREATE CLUSTERED INDEX ci__lnieders_bitmap ON lnieders_bitmap(num);

DECLARE @p2 INT = 16, @fluff VARCHAR(4100) = REPLICATE('Z', 4100);
;WITH nums_1 AS (SELECT TOP (POWER(2, @p2)-1) ROW_NUMBER() OVER(ORDER BY (SELECT NULL)) rn
                 FROM master..spt_values t1 CROSS JOIN master..spt_values t2),
      ctrl_cte AS (SELECT TOP (@p2) rn, SUM(POWER(2, rn - 1)) OVER(ORDER BY rn ROWS UNBOUNDED PRECEDING) rt FROM nums_1),
      nums_2 AS (SELECT nums_1.rn, ctrl_cte.rn target_value FROM nums_1 LEFT OUTER JOIN ctrl_cte ON nums_1.rn = ctrl_cte.rt)
INSERT INTO lnieders_bitmap SELECT TOP(POWER(2, @p2)-1) cx.tv, @fluff FROM nums_2 t1
CROSS APPLY (SELECT MIN(target_value) tv FROM nums_2 t2 WHERE t2.rn >= t1.rn) cx ORDER BY t1.rn ASC;

SELECT COUNT(*) data_page__count 
FROM sys.dm_db_database_page_allocations(db_id(), object_id('lnieders_bitmap'), 1, NULL, 'DETAILED')
WHERE page_type_desc = 'DATA_PAGE';

Joe Obbish read my code above and had some comments:
  •  that code is so confusing to read
  • if change it like so it'll finish in 2 seconds
  • still not the way I'd probably do it if starting from scratch

Thanks, Joe!!  Sure enough, I modified the code according to his suggestions and 65535 rows were created in 2 seconds.  So I increased the expected total number of rows from 65535 to 131071 which is where I wanted to be anyway.  That took four seconds.  To create 131071 rows with my original code would have taken... a *lot* longer.  😁

After Joe's help the code looked like this.


DROP TABLE IF EXISTS #t;
DECLARE @p2 INT = 17;
WITH nums_1 AS (
 SELECT TOP (POWER(2, @p2)-1) ROW_NUMBER() OVER(ORDER BY (SELECT NULL)) rn
 FROM master..spt_values t1
 CROSS JOIN master..spt_values t2
)
, ctrl_cte AS (
 SELECT rn
   , SUM(POWER(2, rn - 1)) OVER (ORDER BY rn ROWS UNBOUNDED PRECEDING) rt
 FROM nums_1
 WHERE rn <= @p2
)
, nums_2 AS (
 SELECT nums_1.rn, ctrl_cte.rn target_value
 FROM nums_1
 LEFT OUTER JOIN ctrl_cte ON nums_1.rn = ctrl_cte.rt
)
SELECT * INTO #t
FROM nums_2
OPTION (RECOMPILE);

DROP TABLE IF EXISTS lnieders_bitmap;
CREATE TABLE lnieders_bitmap(num INT, fluff VARCHAR(4101));
CREATE CLUSTERED INDEX ci__lnieders_bitmap ON lnieders_bitmap(num); 

DECLARE @fluff VARCHAR(4101) = REPLICATE('Z', 4101);
INSERT INTO lnieders_bitmap WITH (TABLOCK)
SELECT MIN(target_value) OVER (ORDER BY rn DESC ROWS UNBOUNDED PRECEDING), @fluff
FROM #t t1
OPTION (RECOMPILE);

Much faster, much nicer. So here's the idea: since each integer value n 1 to 17 is represented in the table with 2^n rows, when rows are distributed to parallel threads by hash the number of rows for the thread will tell me which values went to each thread, too.

Will this also allow me to make observations about the parallel page supplier?  The threads of a parallel scan get their page sets from the parallel page supplier... but there's not much info beyond that publicly available

*****

Later on I thought "hey, I'll save myself some thought if I do this in base 10 rather than base 2."  I also wanted to see how Joe Obbish would have approached creating this type of table from scratch. I asked, and he taught me a new trick (which I'll likely have to keep coming back to here otherwise I won't remember how it worked).

This isn't exactly how Joe did it, but its as close as I get from memory.

This query shows how it works.


;WITH base(base)  AS (SELECT 10),
pwr(pwr_plus1)    AS (SELECT 6),
nums_1(num_1)     AS (SELECT ROW_NUMBER() OVER(ORDER BY(SELECT NULL))
                      FROM master..spt_values t1 CROSS JOIN master..spt_values t2),
nums_2(num_2, tv) AS (SELECT num_1, POWER(base, num_1-1)
                      FROM nums_1 cross join pwr cross join base WHERE num_1 <= pwr.pwr_plus1),
nums_3(num_3)     AS (SELECT num_2 FROM nums_1 JOIN nums_2 ON nums_1.num_1 <= nums_2.tv)
SELECT num_3 val, COUNT(*) num_rows_at_val FROM nums_3 GROUP BY num_3 ORDER BY num_3;

So here's how it comes together to make my table for exploring.


DROP TABLE IF EXISTS b10_bitmap;
CREATE TABLE b10_bitmap(ID BIGINT INDEX pk_b10_bitmap CLUSTERED, FLUFF VARCHAR(4100));

;WITH base(base)  AS (SELECT 10),
pwr(pwr_plus1)    AS (SELECT 6),
nums_1(num_1)     AS (SELECT ROW_NUMBER() OVER(ORDER BY(SELECT NULL))
                      FROM master..spt_values t1 CROSS JOIN master..spt_values t2),
nums_2(num_2, tv) AS (SELECT num_1, POWER(base, num_1-1)
                      FROM nums_1 cross join pwr cross join base WHERE num_1 <= pwr.pwr_plus1),
nums_3(num_3)     AS (SELECT num_2 FROM nums_1 JOIN nums_2 ON nums_1.num_1 <= nums_2.tv),
fluff(fluff)      AS (SELECT REPLICATE('Z', 4100))
INSERT INTO b10_bitmap SELECT num_3 val, fluff FROM nums_3 CROSS JOIN fluff ORDER BY num_3;

UPDATE STATISTICS b10_bitmap(pk_b10_bitmap) WITH FULLSCAN;


That created 111111 rows in 47 seconds.  Let's check up on it... how many data pages?
111,111 data pages - good.


OK, now let's have some fun.


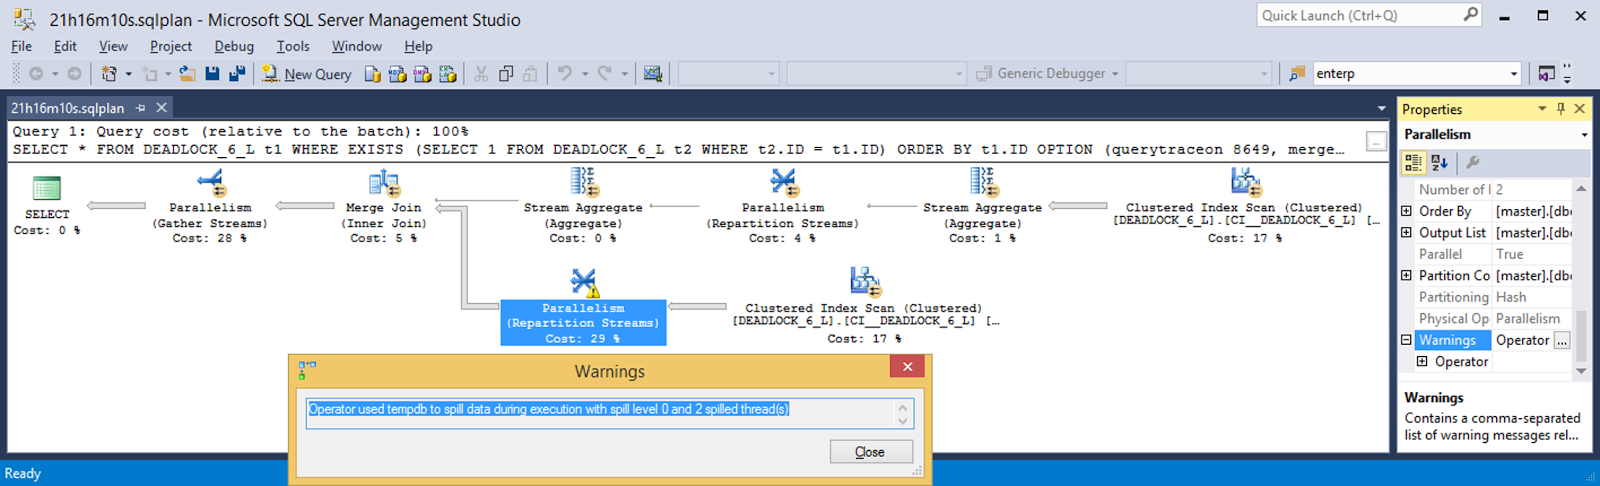
Let's take a look at the spread of rows/pages in that top right clustered index scan. Thread 1 with 55366 rows and thread 2 with 55745.  That's a pretty even split of work between the threads.  That's what we want out of the storage engine scan - split the work fairly evenly among worker threads.


What about the clustered index scan right below it? That's about a 90-10 split.  The storage engine parallel page supplier isn't dividing pages up for the threads based on values in the clustered index - neither of the splits show the kind of numbers needed for the distribution to align with my crafty set of data.  Figuring out how the parallel page supplier is coming up with sets of pages will take more investigation than this post can afford - since it'll require at least one separate investigation method.  I'll have to explore the parallel page supplier more at another time.


On to a peek at how rows are being distributed among parallel threads by a hash function.  The Repartition Streams operator details indicates using a hash to distribute the rows.  Thread 1 handled almost 100 times as many rows as thread 2.  Based on the number of rows of this table each thread handled, we can tell that thread 1 handled the rows with values 5 and 6 while thread 2 handled rows with values 1, 2, 3, and 4.


Here's what distribution of rows looked like at that operator for each DOP from 2 to 6. I'm intrigued, to say the least.  Especially interesting to me is that DOP 5 and DOP 6 each had only 4 threads active.  But the 4 active threads had different values going to them at DOP 5 and DOP 6.


All right.  The role of the fluff was to help explore the parallel page supplier.  I won't get anywhere with that tonight, so let's cut the fluff. GTFOH - Get the fluff out of here! 😁 And let's go back to base 2 - it'll allow me to work more values into a given number of rows. Might as well page compress them, too. This got me 262143 rows in 30 seconds.


CREATE TABLE b2_bitmap(ID BIGINT INDEX pk_b2_bitmap CLUSTERED)
WITH (data_compression = page);

;WITH base(base)  AS (SELECT 2),
pwr(pwr_plus1)    AS (SELECT 18),
nums_1(num_1)     AS (SELECT ROW_NUMBER() OVER(ORDER BY(SELECT NULL))
                      FROM master..spt_values t1 CROSS JOIN master..spt_values t2),
nums_2(num_2, tv) AS (SELECT num_1, POWER(base, num_1-1)
                      FROM nums_1 cross join pwr cross join base WHERE num_1 <= pwr.pwr_plus1),
nums_3(num_3)     AS (SELECT num_2 FROM nums_1 JOIN nums_2 ON nums_1.num_1 <= nums_2.tv)
INSERT INTO b2_bitmap SELECT num_3 val FROM nums_3 ORDER BY num_3;

UPDATE STATISTICS b2_bitmap(pk_b2_bitmap) WITH FULLSCAN;

Pretty tiny table, though. There's room for more - this can only get more interesting with more values in the table. But, I'll stick with this for now.


Here's the query I'm using.  In this case, I'll look at DOP 3 to DOP 12.  At DOP 2, the Repartition Streams operator highlighted before isn't present.  So for now, just look at DOP 3 to DOP 12.


For DOP 3 to DOP 7...


And for DOP 8 to DOP 12...


Ciao for now!

Wednesday, September 20, 2017

SQL Server 2016 Execution Context ID: Trust but Verify II - Short & Sweet

In a previous post, I mentioned that sometimes two separate tasks/workers in a parallel query will identify themselves with the same execution context ID.  A join to sys.dm_os_threads allows identifying tasks with the kpid and clearing up any possible confusion.

Trust but Verify: SQL Server 2016 SP1 CU4 Execution Context ID
http://sql-sasquatch.blogspot.com/2017/09/trust-but-verify-sql-server-2016-sp1.html 

Today I'm just going to pretend that whole issue doesn't exist because I'm feeling lazy. 😊  Let me show another reason that - when it comes to execution context ID - I recommend "trust but verify."

The system I grabbed the graphic below from is, same as the earlier post, SQL Server SP1 CU4.
 
Got a parallel query running, and I want to grab some wait & blocking info for each of the parallel threads.  Makes sense to start in sys.dm_os_tasks and left outer join to sys.dm_os_waiting_tasks.  Because I might have some tasks working at time of capture by the query - they'd be unmatched in the view of waiting tasks.  I've underlined my left outer join back to sys.dm_os_tasks because it was originally unintuitive to do this.  If I want to grab the session ID and execution ID of the task that's blocking... isn't sys.dm_os_waiting_tasks good enough? Well... no. Execution context ID 0 can show up as NULL in the blocking_exec_context_id column, even though the blocking_task_address is populated.  Huh.

No problem, though.  Using that blocking_task_address for a join back to sys.dm_os_tasks allows me to see that execution context ID 2 below is blocked by execution context ID 0 within the same query.


Good.  That's enough for tonight.

Tuesday, September 19, 2017

#SQLServer 2016 SP1 CU4 vs CU2: Deep Sleepers and a Nervous Waker in the Deadzone

We got a deadzone in SQL Server 2016 SP1 CU4.  A small amount of testing on SQL Server 2016 SP1 CU3 indicates the deadzone behavior was introduced in CU4 and not earlier.  Rather than re-generate a bunch of stuff I have from CU2 in CU3, though, for the sake of me finally getting something more info about this scenario into the blog-o-sphere, I'll be comparing the behavior of SP1 CU4 to SP1 CU2 here.

The deadzone... for hours, four deep sleepers and one nervous waker for a MAXDOP 2 query try to get it out... usually they do.  But it can take hours... sometimes days.

My current theory as to what is happening: for some reason, the deadlock monitor is prompting the wrong producer at the exchange to spill.  That producer wakes up... can't spill... so goes immediately back to sleep.  After some indeterminate amount of time, the deadlock monitor finally prompts the right producer to spill - one that *can* spill.  It does spill, and then the query progresses.  What leads to the change in which thread gets kicked by the deadlock monitor to spill?  I don't know... and not sure I can determine that without access to source code.

 *****

Joe Obbish used a heading of "Putting the Dead in Deadlock" in his related blog post... I'm so impressed with that turn of phrase I have to try some of my own. :-) Joe's post is here...

Hash Partitioned Exchange Spills
https://orderbyselectnull.com/2017/09/15/hash-partitioned-exchange-spills/

And there is a Connect item...
Order Preserving Repartition Streams Can Cause Extreme Performance Degradations
https://connect.microsoft.com/SQLServer/feedback/details/3141119/order-preserving-repartition-streams-can-cause-extreme-performance-degradations

Let's start this adventure the way I started it: by looking at some frustrating behavior on SQL Server 2016 SP1 CU4. Below is the setup, followed by the troubled query.  The table created in the setup is as simple as it gets: single column BIGINT, in a clustered index.  13890 zeroes inserted, followed by 13890 ones.  Update stats on the clustered index before the first attempt at producing an egregious hang, so every execution is on a level playing field. Trace flag 8649 is used here so cost doesn't prevent a parallel plan.  Hint the merge join to get order-preserving exchanges.  The same problem occurs at higher DOP than 2... but when investigating a problem with parallel queries, I recommend working with the lowest DOP where the behavior can be reproduced for the sake of simplicity.

/* the setup: drop/create a single BIGINT column table w/CI
              populate the table with 13890 0s and 13890 1s */ 
DROP TABLE IF EXISTS DEADLOCK_6_L
CREATE TABLE DEADLOCK_6_L(ID BIGINT);
CREATE CLUSTERED INDEX CI__DEADLOCK_6_L ON DEADLOCK_6_L(ID);

INSERT INTO DEADLOCK_6_L SELECT 0 FROM
(SELECT TOP (13890) row_number() over(order by (select null)) RN
 FROM master..spt_values t1 CROSS JOIN master..spt_values t2) subQ;

INSERT INTO DEADLOCK_6_L SELECT 1 FROM
(SELECT TOP (13890) row_number() over(order by (select null)) RN
 FROM master..spt_values t1 CROSS JOIN master..spt_values t2) subQ;

UPDATE STATISTICS DEADLOCK_6_L(CI__DEADLOCK_6_L) WITH FULLSCAN;

/* might take up to 20 repetitions of the query below 
   to get exchange spill (CU2) or "the deadzone" (CU4) */ 

SELECT * FROM DEADLOCK_6_L t1 WHERE EXISTS
(SELECT 1 FROM DEADLOCK_6_L t2 WHERE t2.ID = t1.ID)
ORDER BY t1.ID OPTION (querytraceon 8649, merge join, maxdop 2);

I've run the setup and the trouble query in a user database with 8 equally-sized data files, and in a single-file master database, with the same results.  When the query is fast... its fast.  But when its slow, it can take hours to complete.  Sometimes days.

Here's live query stats from an example - in fact one that's running as I'm typing in this post.


As I was running these tests, I made sure that "live query stats" and "include actual plan" were toggled on for my session.  So sys.dm_exec_query_profiles info was available for the session.


Whew!!  That one finally completed. 21 hours, 16 minutes, 10 seconds as reported by SSMS.


Lets take a look at that post-execution plan for clues.  There's a warning on the Repartition Streams - what's it say?


OK, what about the waits recorded by the post-execution plan?  Huh. That's a total of only 176 ms of wait time. 4071 ms of CPU time.  And 76569190 ms of elapsed time (21h16m9s190ms).  That doesn't add up in any way, shape, or form. 


What does sys.dm_exec_session_wait_stats say?  *That* makes more sense.  306270624 ms of CXPACKET wait time.  85h6m30s624ms among the 5 threads that last long enough to be observed.


Thursday, September 14, 2017

Trust but Verify: SQL Server 2016 SP1 CU4 Execution Context ID

The @@version of the system I'm currently working on:


I spend a lot of time looking at sys.dm_os_waiting_tasks for parallel queries these days. For parallel queries, multiple sys.dm_os_waiting_tasks rows for a single execution context ID within a session is not unusual.  For example...


Got two rows for session_id 68 exec_context_id 1 above.  Matching the blocking_task_address in those rows to waiting_task_address... ok, exec_context_id 1 is slotted in CXPACKET wait for exec_context_id 3 and 4.  That's reasonable.  As DOP increases the number of exec_context_id values with multiple rows may also increase.  At really high DOP the number of CXPACKET rows can look downright scary :-)  But still legit once used to seeing it.

Here's the waiting tasks for another parallel query.


Like the previous results, there are two rows for exec_context_id 1.  Yeah, we've seen that before :-)

There are also 2 rows for exec_context_id 4.  Hmmm.  That seems plausible.  They show the same resource_address, show the same blocking_task_address.

However... don't be too quick to brush off multiple rows for a given exec_context_id as due to the parallel CXPACKET wait implementation we just discussed.  Or to the "not always transactionally consistent" nature of some of the DMVs.

Check it out below.   The two rows with exec_context_id value 4 have different values for waiting_task_address, and different wait_duration_ms values.  They are different tasks, on different workers.  They really shouldn't be reported as the same exec_context_id.


Does this matter?  Well - the presence of these duplicate values for exec_context_id doesn't seem to be an indication of anything nefarious under the hood.  But if you try to piece together wait information for parallel queries, things can get confusing if not ready to accommodate this possibility.  And monitoring/trending utilities that collect and correlate information from the DMVs can compound the confusion.

Trust but verify, y'all.

Ciao, thanks for reading!

And if you really have a hankerin' for more of the same...

SQL Server 2016 Execution Context ID: Trust but Verify II - Short & Sweet
http://sql-sasquatch.blogspot.com/2017/09/sql-server-2016-execution-context-id.html 

PowerShell connection to SQL Server: MARS enabled, pooling disabled


Sometimes I have to troubleshoot connection issues... or even query performance issues... for various applications.  It can be very valuable to mimic the connection settings including MARS and connection pooling.

Here's how to do that - code snippets at the end of the post.

In the capture below I construct my desired connection string - in this case with MARS enabled and connection pooling disabled.  I bring back one row/one column with a SQL statement just to confirm it worked :-)


Here I specifically enabled MARS because its something I'm looking into right now.

Can we see the MARS connection from the database server side?  Yep.  Code snippet for this also at the end of the blog post.


OK.  Let's be nice and call Dispose.  Oops - typo. Try again.


OK.  Since Connection Pooling was disabled for this connection, it should disappear right away.  And it is really gone. (It can take 4 to 8 minutes for an idle pool connection to disappear by default.)


The PowerShell code...


$scon = New-Object System.Data.SqlClient.SqlConnection
$scon.ConnectionString = "Data Source=localhost;Initial Catalog=MASTER;Connection Timeout=15;Integrated Security=true;MultipleActiveResultSets=True;Pooling=False"
$cmd = New-Object System.Data.SqlClient.SqlCommand
$cmd.Connection = $scon
$cmd.CommandText = "SELECT db_name();"
$cmd.CommandTimeout = 0
$scon.Open()
$adp = New-Object System.Data.SqlClient.SqlDataAdapter $cmd
$data = New-Object System.Data.DataSet
$adp.Fill($data) | Out-Null
$data.Tables
$scon.Dispose()

The SQL query to see the PowerShell MARS session...


select conn.net_transport, conn.connection_id, conn.parent_connection_id, conn.session_id, 
       conn.num_reads, conn.last_read, conn.num_writes, conn.last_write,
       sess.login_time, sess.client_interface_name from sys.dm_exec_connections conn
join sys.dm_exec_sessions sess on sess.session_id = conn.session_id
where exists 
(select 1 from sys.dm_exec_connections ic where ic.session_id = conn.session_id and ic.net_transport = 'Session')
AND sess.login_time > '2017-09-14 10:20:00'
order by conn.session_id;