(My presentation can be found here:
http://www.sqlsaturday.com/600/Sessions/Details.aspx?sid=59564)
Here's ~72 minutes of activity logged in 1 second increments, captured in both a binary blg file and a flat file csv format. 553 columns including the timestamp.
That's more than a 6 times difference in size!
For that reason *if* I use a binary log file at all, I put in a limited set of counters. This is a typical counter set that I may use when capturing perfmon in a blg binary file.
\SQLServer:Access Methods\Full Scans/sec
\SQLServer:Access Methods\Index Searches/sec
\SQLServer:Access Methods\Page Splits/sec
\SQLServer:Access Methods\Range Scans/sec
\SQLServer:Backup Device\*
\SQLServer:Buffer Manager\*
\SQLServer:Buffer Node(*)\*
\SQLServer:Databases(_Total)\Backup/Restore Throughput/sec
\SQLServer:Databases(_Total)\Bulk Copy Rows/sec
\SQLServer:Databases(_Total)\Bulk Copy Throughput/sec
\SQLServer:Databases(_Total)\DBCC Logical Scan Bytes/sec
\SQLServer:Databases(_Total)\Log Bytes Flushed/sec
\SQLServer:Databases(_Total)\Log Flushes/sec
\SQLServer:Databases(tempdb)\Data File(s) Size (KB)
\SQLServer:General Statistics\Logins/sec
\SQLServer:General Statistics\User Connections
\SQLServer:Locks(*)\Lock Requests/sec
\SQLServer:Locks(*)\Lock Waits/sec
\SQLServer:Memory Manager\*
\SQLServer:Memory Node(*)\*
\SQLServer:Plan Cache(*)\Cache Pages
\SQLServer:Resource Pool Stats(*)\*
\SQLServer:SQL Statistics\Batch Requests/sec
\SQLServer:SQL Statistics\SQL Compilations/sec
\SQLServer:SQL Statistics\SQL Re-Compilations/sec
\SQLServer:Transactions\Free Space in tempdb (KB)
\SQLServer:Wait Statistics(*)\*
\SQLServer:Workload Group Stats(*)\*
There's only a few reasons I personally use a binary file for logging perfmon, anyway. One is a timing issue. If logman is used to start logging perfmon, and the data collector is started *before* the SQL Server service is started, the only format that can capture the SQL Server specific counters like the list above: blg. That can be a pain in the neck when trying to capture perfmon on a Windows cluster, or around a maintenance window where server restart is expected.
Binary format is kinda nice because as soon as its opened it opens in a graphing interface.
But with a long counter list... that's just a mess.
I do a lot of work in Excel. Years ago I used tsv format mainly for logging perfmon. But then somewhere along the line, Excel stopped recognizing tsv as a native filetype for itself. I messed around changing associations for a while... ending up giving up and using csv format from then on.
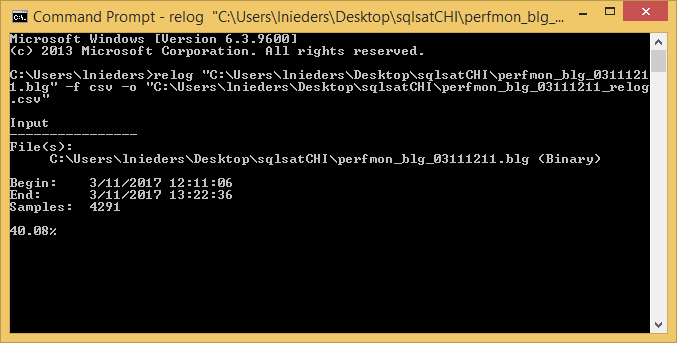
So if I do get a large blg binary format perfmon capture, I relog it. Like this...
relog "C:\Users\lnieders\Desktop\sqlsatCHI\perfmon_blg_03111211.blg" -f csv -o "C:\Users\lnieders\Desktop\sqlsatCHI\perfmon_blg_03111211_relog.csv"
This is the relog in a cmd.exe while its in flight.
And when its complete...
Here's the results of the relog.
So the csv from relogging the blg is still larger than the csv that was captured in csv format. But way smaller than the original blg itself.
And once its in csv format, I can make all of my crazy graphs in Excel 😊
Here's a reference for logman to capture perfmon logs.
https://technet.microsoft.com/en-us/library/bb490956.aspx
And a reference for relog if you want to change log format, narrow the time window, pull out a subset of counters, etc.
https://technet.microsoft.com/en-us/library/bb490958.aspx


No comments:
Post a Comment