In 2018 I wrote two blog posts about memory accounting behavior on NUMA servers I was seeing in SQL Server 2016, 2017, and eventually 2019.
Some amount of memory counted by a SQLOS memory node as [Stolen Memory] was *also* counted by another SQLOS memory node as [Database cache].
2018 July 2
https://sql-sasquatch.blogspot.com/2018/07/sql-server-2016-memory-accounting.html
https://sql-sasquatch.blogspot.com/2018/10/sql-server-2016-memory-accounting-part.html
At first I thought it likely to be a reporting error only - something that made the numbers not tie out unless it was taken into consideration.
Maybe such a condition could exist without bubbling up as a performance degradation or error situation?
As I continued to observe the issue, however, I took note of the ways this double-counting of memory could result in performance drag or errors. I won't detail that here, but it is worth noting that KB4536005, which resolved this condition, lists out of memory errors as a potential consequence of this accounting error.
#SQLServer 2017 CU20
#SQLServer 2016 SP2 CU15
At about the same time as noticing that some memory was double-counted among the SQLOS nodes, I noticed something else. Occasionally, one or more SQLOS memory nodes would report an outlandishly high number as the free SQLOS memory on that node. The number was obvious nonsense as it was higher than the amount of vRAM available to the vm.
I rationalized this as probably the result of a race condition at a time of low free memory - values for two memory measures reported at slightly different times yielding a negative number which came through the performance object as an absurdly high positive number. Because there were other memory issues to chase after, I was satisfied with the answer I provided myself, and willing to believe the condition could exist without any appreciable effect on performance or errors.
It's a few years later now and... uh... I no longer believe that.
I've seen cases where that ridiculously high SQLOS node free memory values are reported on the same SQLOS node every 30 seconds for two straight hours. I've seen cases where two of four SQLOS nodes are reporting the absurd high values at the same time. Nope, doesn't fit the profile of benign race condition anymore. Maybe I could just let it go if one of the SQL Server instances where this occurs doesn't also have active investigation for frequent buffer latch timeouts and for SQL Server seemingly failing to respond to low memory conditions.
OK, so I have to dig in.
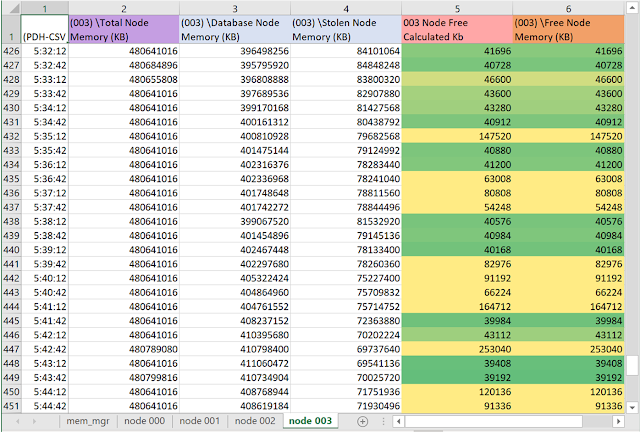
In this post I will stray from my typical, graph heavy presentation. This one works better as tables, because the free memory involved is so doggone small compared to database cache and stolen memory it's really hard to find on the graph.
All of the tables below are from a single system, running SQL Server 2019 cu9. Perfmon is capturing lots of counters every 30 seconds.
First we'll look at instance-wide numbers from [\SQLServer:Memory Manager].
[Database Cache Memory (KB)] is in column 3 with a light blue header.
[Stolen Server Memory (KB)] is in column 4, also with a light blue header.
I expect to see the same relationship at the SQLOS memory node level, as we look at [\SQLServer:Memory Node(*)] counters. Indeed in each of the tables below this calculation for the memory node holds true, as the similar calculation holds true for the memory manager:
- [\SQLServer:Memory Node(*)\Database Node Memory (KB)]
- [\SQLServer:Memory Node(*)\Stolen Node Memory (KB)]
= [\SQLServer:Memory Node(*)\Free Node Memory (KB)]


No comments:
Post a Comment