Showing posts with label SQLServer. Show all posts

Monday, February 28, 2022

#SQLServer Trivial Plans for Inserts; Stats Expectations and Reality

OK.  SQL Server trivial plans for rowstore table INSERT. And related optimizer stats interaction.

TL;DR cached trivial plans for INSERT can be surprisingly stubborn. If a query matches to one, it won't perform or queue a stats update even if the stats are stale.  If the stats have been updated and would otherwise warrant a per-index plan - but there is a matching cached trivial plan for a per-row plan... outta luck. Might hafta DBCC FREEPROCCACHE or add OPTION(RECOMPILE) hint to make sure a cached trivial plan doesn't prevent a per-index update for an INSERT when you really want one.

~~~~ 

The blog post referenced below, first published 2015 March 16, is pretty good.

The relevant takeaway from that post is: in a database with AUTO_UPDATE_STATISTICS = ON, a statistics update will NOT invalidate a relevant cached query plan. A subsequent query which qualifies to use a cached plan will continue to use the cached trivial plan. This is Scenario 1 in the blog post. The following text is directly from the blog post.

When a plan is trivial, it’s unnecessary to recompile the query even statistics has been updated.  Optimizer generates trivial plan for very simple queries (usually referencing a single table).  In XML plan, you will see statementOptmLevel="TRIVIAL". In such case, it’s futile and you won't get a better or different plan.

The demo code in the blog post uses SELECT queries only. In my examples in my own blog post, I'm concerned with INSERT queries.  Are INSERT queries eligible for both trivial plans and plans that have been more fully optimized? If INSERT queries can use a trivial plan, is it possible for a cached trivial plan to remain in use when a better and/or different plan could be selected?

Perhaps the reader is familiar with the Paul White blog post referenced below, from 2013 January 26. In that blog post, Paul White discusses wide, per-index INSERT query plans and narrow, per-row INSERT query plans.  How do these plan types relate to trivial plans?

OK. Enough jibber-jabber. Time to do something. Like create a stored procedure.  Which will be used in a database with AUTO_UPDATE_STATISTICS = ON and AUTO_UPDATE_STATISTICS_ASYNC = OFF.

This stored procedure will drop two tables if they already exist, then create those two tables.  The source table has three columns and a single index - the clustered primary key.  The target table also has three columns and a clustered primary key. In addition the target table has two non-clustered indexes.

The @insert_no_rows parameter controls whether or not there will be an INSERT query from the empty source table to the empty target table. That wouldn't move any data - but maybe it will cache a plan?

The INSERT query is dynamic SQL - both in the stored procedure and when I issue it adhoc later.  It isn't necessary for this query to be dynamic SQL - it was just easier that way to make sure the batch SQL text matched and plan re-use happened when it was a possibility. While writing this blog post at one point the query SQL text in the stored procedure has a different number of tabs preceding the formatted T-SQL than appeared in my adhoc query afterward and it took me forever to figure out why plan re-use wasn't occurring. :-) 

CREATE OR ALTER PROCEDURE test__trivial_plan_inserts @insert_no_rows INT = 0, @x INT = 0
AS
BEGIN
	DROP TABLE IF EXISTS trivial_test_source;
	DROP TABLE IF EXISTS trivial_test_target;

	CREATE TABLE trivial_test_source
	(	col1 INT CONSTRAINT pk__trivial_test_source PRIMARY KEY CLUSTERED
	,	col2 INT
	,	col3 INT
	);

	CREATE TABLE trivial_test_target
	(	col1 INT CONSTRAINT pk__trivial_test_target PRIMARY KEY CLUSTERED
	,	col2 INT INDEX nci__trivial_test_target__col2
	,	col3 INT INDEX nci__trivial_test_target__col3
	);

	-- white space in the INSERT dynamic SQL must match exactly
	-- in stored procedure and adhoc EXEC for cached plan reuse
	IF @insert_no_rows = 1
	BEGIN
		DECLARE @sqlT NVARCHAR(1000) = N'INSERT INTO trivial_test_target SELECT * FROM trivial_test_source;'
		EXEC (@sqlT);
	END
	-- white space in the INSERT dynamic SQL must match exactly
	-- in stored procedure and adhoc EXEC for cached plan reuse

	;WITH	n0 AS (	SELECT TOP (32) n = 1 
					FROM master.dbo.spt_values)
	,		n1 AS (	SELECT n = ROW_NUMBER() OVER (ORDER BY(SELECT NULL))
					FROM n0 t1 CROSS JOIN n0 t2)
	INSERT INTO	trivial_test_source
	SELECT		TOP (@x) n, n, n
	FROM		n1;
END

For the first experiment, let's not worry about caching plans. Let's call the stored procedure like this:

EXEC test__trivial_plan_inserts @insert_no_rows = 0, @x = 1023;

So, give me 1023 rows in table trivial_test_source.

After the stored procedure executes, let's grab an actual plan from this simple INSERT query:

DECLARE @sqlT NVARCHAR(100) = N'INSERT INTO trivial_test_target SELECT * FROM trivial_test_source;'
EXEC (@sqlT);
-- white space in the INSERT dynamic SQL must match exactly
-- in stored procedure and adhoc EXEC for cached plan reuse

And here's the actual plan.  That's a narrow, per-row plan. Note the estimate of 1023 rows; dead-on.


The Object properties in the graphical plan specify the target table indexes which will be updated for each row inserted into the clustered index. So far, so good.


If we look at the plan XML, we can see this is a trivial plan.


OK. Now let's call the stored procedure like this:
EXEC test__trivial_plan_inserts @insert_no_rows = 0, @x = 1024;


That will drop the source and target tables, recreate the tables, and populate the source table with 1024 rows instead of the previous 1023.

Now get an actual plan for the insert again:

DECLARE @sqlT NVARCHAR(100) = N'INSERT INTO trivial_test_target SELECT * FROM trivial_test_source;'
EXEC (@sqlT);
-- white space in the INSERT dynamic SQL must match exactly
-- in stored procedure and adhoc EXEC for cached plan reuse

And... bam!!! Yeah, the graphical plan below certainly looks like a different plan. This is what Paul White refers to as a wide, per-index update.

First, at the right of the blue box below, the source table scan operator feeds rows into the clustered index insert operator. No sort is needed to optimize the insert because the source and target tables have the same primary key clustered index definition. These rows are also fed into a table spool at the left of the blue box below.  The table spool at the left of the blue box is the same table spool at the left of the gold box - just different zones of the same plan.


Table spool populated, it is used as a source for a sort, then insert into a non-clustered index.  This happens once in the upper blue box, then again in the lower gold box.


Demonstrating the benefit of a per-index update over a per-row update for an INSERT of many thousand rows is left as an exercise for the reader.

While I won't investigate at this time, I do want to make note of an interesting switcheroo that takes place. Recall that within the CREATE TABLE, the clustered primary key and the two non-clustered indexes on col2 and col3 were created with inline syntax.


How did the non-clustered index on col3 become index_id 2, while the nonclustered index on col2 became index_id 3?  I don't know - and i don't know of anywhere that could be consequential. Yet.


How did I notice that little switcheroo?  Well, every per-index INSERT graphical plan I've seen has shown indexes in index_id order from top-down.  And when I've observed large per-index updates with sys.dm_tran_locks, the acquisition of locks over time by the session indicates indexes are tended to in index_id order.  I won't at this time be investigating further whether per-index updates always handle indexes in index_id order, or how the little index_id switcheroo occurred. Just an interesting bread crumb.

Before we do the next part I want to make sure the database is set up like I think...
Excellent, exactly what I wanted.


So. This time we drop the tables and recreate them. We issue the INSERT INTO... SELECT while both source and target tables are empty. Then populate the source table with 1024 rows.

EXEC test__trivial_plan_inserts @insert_no_rows = 1, @x = 1024;

And now we are ready to grab an actual plan...

DECLARE @sqlT NVARCHAR(100) = N'INSERT INTO trivial_test_target SELECT * FROM trivial_test_source;'
EXEC (@sqlT);
-- white space in the INSERT dynamic SQL must match exactly
-- in stored procedure and adhoc EXEC for cached plan reuse

So now we have 1024 rows - that number of rows previously got a per-index update plan.  But this time it got a per-row plan. Huh.


Well, what the heck.  If we look at the plan XML we see a clue. RetrievedFromCache.


Now wait just a minute. That source table went from 0 rows to 1024 rows; did the stats get updated?

Wow. I guess not. When the insert matched a cached trivial plan, the stats did not get updated even though they were stale and auto update stats is true in this database.


So - what if I try this again? Drop the tables, recreate the tables, run the insert with zero rows to put a plan in the cache. Put 1024 rows in the source table. Then... I'll explicitly update stats.

EXEC test__trivial_plan_inserts @insert_no_rows = 1, @x = 1024;
UPDATE STATISTICS trivial_test_source;

OK, stats are updated.


So what happens now? Ouch. It doesn't matter.  If the stats are stale and there's a matching cached trivial plan - the stats don't get updated.  If the stale stats ARE updated before the query is executed - the matching trivial plan isn't invalidated. So that matching cached trivial plan will still be used. Even though I don't want it to be used. I just want SQL Server to take a fresh look at what's going on.

And that fresh look can solve the problem.  Clearing the plan cache with DBCC FREEPROCCACHE (or ALTER DATABASE SCOPED CONFIGURATION CLEAR PROCEDURE CACHE in the relevant database) would cause SQL Server to take a fresh look, and decide if the INSERT should get a per-index plan instead of a per-row plan*.  Tacking OPTION(RECOMPILE) hint on to the end of that INSERT would also work in a much more targeted manner. Sometimes, in order to prevent a cached trivial plan from forcing a per-row update when we really want a per-index update, gonna hafta encourage SQL Server to take a fresh look in one of those ways.

*There are a number of SQL Server instance-wide configuration settings changes to which will also clear plan cache, such as maxdop and cost threshold for parallelism. But i don't recommend changing any of them solely to clear plan cache. Microsoft lists the configuration options which clear plan cache on the following BOL page.

Friday, April 17, 2020

SQL Server 2017 cu17 Columnstore Workload OOMs Part 2: Whoever Smelt It, Dealt It?

This blog post is under construction...

This blog post is part of a series started yesterday with the post linked immediately below.

SQL Server 2017 cu17 ColumnStore Workload OOMs Part 1
https://sql-sasquatch.blogspot.com/2020/04/sql-server-2017-cu17-columnstore.html


Error investigation can be informed by one of two paradigms:
I think of the first paradigm as "whoever smelt it, dealt it."
The second paradigm is "the bearer of bad news."
Sometimes to reach the correct conclusion, the events and surrounding timeline must be examined from both viewpoints.

Whoever Smelt It, Dealt It

This article provided some needed laughter yesterday when I read it.  Its not directly relevant to the matter at hand... but its worth a chuckle.


We Asked Scientists Whether He Who Smelt It Really Dealt It

https://www.vice.com/en_us/article/ypa5x5/we-asked-scientists-whether-he-who-smelt-it-really-dealt-it

What the heck does this sophomoric idea have to do with OOMs, or any error type?

Consider this simplistic example.  The error is a direct result of the action by this session.  This session's action alone was sufficient to warrant the "divide by zero" error message.
This session smelt the error message, because this session dealt the divide by zero.


As it relates to OOMs, consider the OOM described in this blog post.
SQL Server 2019 Scalar UDF inlining - OOM in some cases
https://sql-sasquatch.blogspot.com/2019/11/sql-server-2019-udf-inlining-oom-in.html

A single session in isolation executing a query with an ugly UDF that triggers UDF inlining is sufficient to consume enough [Optimizer Memory] to result in the OOMs described in the post.  Yes, its a (fixed in CU2) bug, but the activity by that individual session realizes the risk presented by the bug.  That session  smelt it by way of the OOM, after that session dealt it by using an ugly inlined UDF.

OK.  Now let's focus on the OOMs I'm currently dealing with.  In SQL Server, if an OOM can be properly described as "whoever smelt it, dealt it" the memory activity must be attributable to the session that received the error and only that session.

One way for that to be the case is for that session to be running in isolation - no other user sessions on the instance.  That's not the case in observations of the OOMs I'm concerned with.  Each occurrence of these OOMs happens to be when there are multiple concurrent user sessions.

Another way for the memory activity to be attributable to the specific session that received the error is if the memory type is specifically and solely allocated to the session.  Connection memory works like that.  Connection memory is within [Total Server Memory] but individual sessions have private access to small chunks of it.  Optimizer memory works that way, too.  So, too, does the used portion of query memory grants.  All of the memory in [Total Server Memory] that can be individually attributed to sessions is within [Stolen Server Memory].  But not all [Stolen Server Memory] can be individually attributed to sessions.  (For example, consider the plan cache within [Stolen Server Memory].  Although an individual session inserts a plan into cache, while the plan is cached other sessions can use it.  And a cached plan can stay in cache after the session that originally inserted it has ended.)

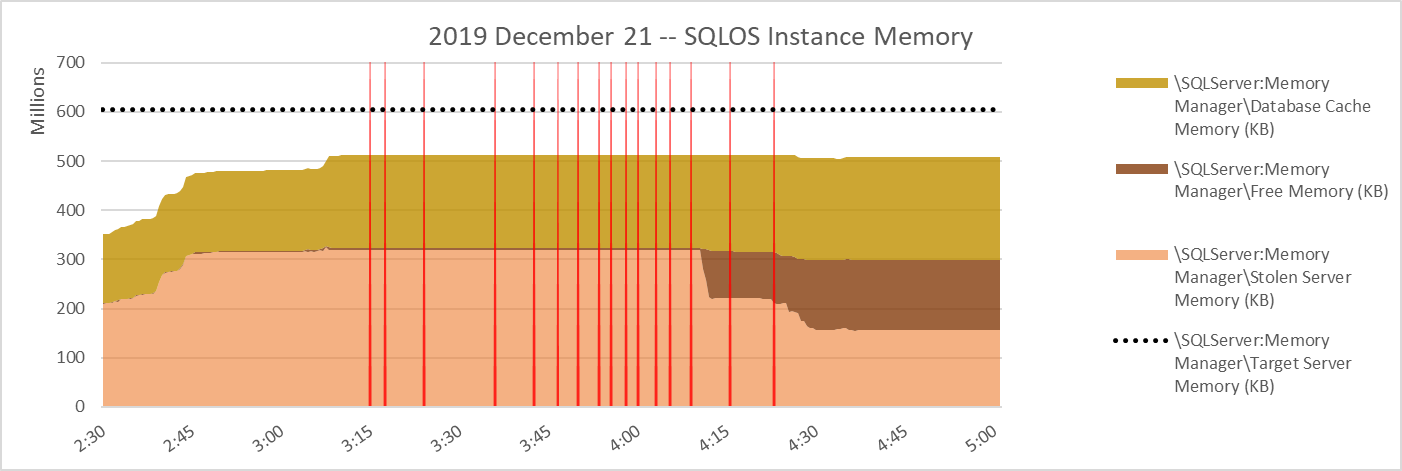
It just so happens I have some graphs. Each of the red vertical lines below is an OOM.  Usually in a graph like this I have [Stolen Server Memory] at the top of the stacked graph, with [Free Memory] and [Database Cache Memory] below it.  Like this...


But since I want to focus on [Stolen Server Memory] I want it at the bottom of the stack for now, like this...


In the workloads I am concerned with, the largest portion of individually attributable [Stolen Server Memory] is the amount of granted query memory that is used for sort/hash/columnstore compression at any given time.  If all user workload groups are associated with the Default Resource Pool, that amount is [\SQLServer:Memory Manager\Granted Workspace Memory (KB)] - [\SQLServer:Memory Manager\Reserved Server Memory (KB)].  If user Resource Pools other than Default during the timeperiod of concern, the information should be gathered from sys.dm_exec_query_memory_grants and/or sys.dm_exec_query_resource_semaphores to account for the total granted and total reserved memory.

Fortunately for me, on this day the only resource pools present were Default and Internal.  A little bit easier path.

The next graph is the amount of granted memory (not necessarily already used), with [\SQLServer:Memory Manger\Total Server memory (KB)] included on the same graph for scale.

First of all, I'll point out that the total granted memory is not very high compared to the target server memory. Also, the yellow box indicates high points for granted memory that occurred without errors, while errors occurred later with lower levels of granted memory.


Let's zoom in a little for better visibility.  This graph is granted memory - but it doesn't indicate how much of the granted memory is used.


Because on the Default resource pool was in play, layering the reserved memory in front of granted memory gives an idea of the used query memory.  In the graph below, the exposed dark green is the portion of [\SQLServer:Memory Manager\Granted Workspace Memory (KB)] which is used. 


well, well...


well, well....


Date,Source,Severity,Message
12/21/2019 03:15:35,spid83,Unknown,Memory Broker Clerk (Column store object pool)      Pages<nl/>---------------------------------------- ----------<nl/>Total                                      34670319<nl/>Simulated                                    166692<nl/>Simulation Benefit                                0<nl/>Internal Benefit                                  0<nl/>External Benefit                                  0<nl/>Value Of Memory                                   0<nl/>Periodic Freed                                    0<nl/>Internal Freed                                    0
12/21/2019 03:17:51,spid79,Unknown,Memory Broker Clerk (Column store object pool)      Pages<nl/>---------------------------------------- ----------<nl/>Total                                      34670319<nl/>Simulated                                    166692<nl/>Simulation Benefit                                0<nl/>Internal Benefit                                  0<nl/>External Benefit                                  0<nl/>Value Of Memory                                   0<nl/>Periodic Freed                                    0<nl/>Internal Freed                                    0
12/21/2019 03:24:14,spid51,Unknown,Memory Broker Clerk (Column store object pool)      Pages<nl/>---------------------------------------- ----------<nl/>Total                                      34670319<nl/>Simulated                                    166692<nl/>Simulation Benefit                                0<nl/>Internal Benefit                                  0<nl/>External Benefit                                  0<nl/>Value Of Memory                                   0<nl/>Periodic Freed                                    0<nl/>Internal Freed                                    0
12/21/2019 03:36:41,spid73,Unknown,Memory Broker Clerk (Column store object pool)      Pages<nl/>---------------------------------------- ----------<nl/>Total                                      34670319<nl/>Simulated                                    166692<nl/>Simulation Benefit                                0<nl/>Internal Benefit                                  0<nl/>External Benefit                                  0<nl/>Value Of Memory                                   0<nl/>Periodic Freed                                    0<nl/>Internal Freed                                    0
12/21/2019 03:43:01,spid89,Unknown,Memory Broker Clerk (Column store object pool)      Pages<nl/>---------------------------------------- ----------<nl/>Total                                      34670319<nl/>Simulated                                    166692<nl/>Simulation Benefit                                0<nl/>Internal Benefit                                  0<nl/>External Benefit                                  0<nl/>Value Of Memory                                   0<nl/>Periodic Freed                                    0<nl/>Internal Freed                                    0
12/21/2019 03:47:00,spid55,Unknown,Memory Broker Clerk (Column store object pool)      Pages<nl/>---------------------------------------- ----------<nl/>Total                                      34670319<nl/>Simulated                                    166692<nl/>Simulation Benefit                                0<nl/>Internal Benefit                                  0<nl/>External Benefit                                  0<nl/>Value Of Memory                                   0<nl/>Periodic Freed                                    0<nl/>Internal Freed                                    0
12/21/2019 03:50:43,spid57,Unknown,Memory Broker Clerk (Column store object pool)      Pages<nl/>---------------------------------------- ----------<nl/>Total                                      34670740<nl/>Simulated                                    166692<nl/>Simulation Benefit                                0<nl/>Internal Benefit                                  0<nl/>External Benefit                                  0<nl/>Value Of Memory                                   0<nl/>Periodic Freed                                    0<nl/>Internal Freed                                    0
12/21/2019 03:54:08,spid73,Unknown,Memory Broker Clerk (Column store object pool)      Pages<nl/>---------------------------------------- ----------<nl/>Total                                      34639426<nl/>Simulated                                    250762<nl/>Simulation Benefit                                0<nl/>Internal Benefit                                  0<nl/>External Benefit                                  0<nl/>Value Of Memory                                   0<nl/>Periodic Freed                                    0<nl/>Internal Freed                                84070
12/21/2019 03:56:07,spid73,Unknown,Memory Broker Clerk (Column store object pool)      Pages<nl/>---------------------------------------- ----------<nl/>Total                                      34639426<nl/>Simulated                                    250762<nl/>Simulation Benefit                                0<nl/>Internal Benefit                                  0<nl/>External Benefit                                  0<nl/>Value Of Memory                                   0<nl/>Periodic Freed                                    0<nl/>Internal Freed                                84070
12/21/2019 03:58:37,spid73,Unknown,Memory Broker Clerk (Column store object pool)      Pages<nl/>---------------------------------------- ----------<nl/>Total                                      34639426<nl/>Simulated                                    250762<nl/>Simulation Benefit                                0<nl/>Internal Benefit                                  0<nl/>External Benefit                                  0<nl/>Value Of Memory                                   0<nl/>Periodic Freed                                    0<nl/>Internal Freed                                84070
12/21/2019 04:00:43,spid52,Unknown,Memory Broker Clerk (Column store object pool)      Pages<nl/>---------------------------------------- ----------<nl/>Total                                      34639426<nl/>Simulated                                    250762<nl/>Simulation Benefit                                0<nl/>Internal Benefit                                  0<nl/>External Benefit                                  0<nl/>Value Of Memory                                   0<nl/>Periodic Freed                                    0<nl/>Internal Freed                                84070
12/21/2019 04:03:27,spid70,Unknown,Memory Broker Clerk (Column store object pool)      Pages<nl/>---------------------------------------- ----------<nl/>Total                                      34639437<nl/>Simulated                                    250718<nl/>Simulation Benefit                                0<nl/>Internal Benefit                                  0<nl/>External Benefit                                  0<nl/>Value Of Memory                                   0<nl/>Periodic Freed                                    0<nl/>Internal Freed                                84070
12/21/2019 04:05:45,spid74,Unknown,Memory Broker Clerk (Column store object pool)      Pages<nl/>---------------------------------------- ----------<nl/>Total                                      34639437<nl/>Simulated                                    250718<nl/>Simulation Benefit                                0<nl/>Internal Benefit                                  0<nl/>External Benefit                                  0<nl/>Value Of Memory                                   0<nl/>Periodic Freed                                    0<nl/>Internal Freed                                84070
12/21/2019 04:09:38,spid70,Unknown,Memory Broker Clerk (Column store object pool)      Pages<nl/>---------------------------------------- ----------<nl/>Total                                      34639440<nl/>Simulated                                    250706<nl/>Simulation Benefit                                0<nl/>Internal Benefit                                  0<nl/>External Benefit                                  0<nl/>Value Of Memory                                   0<nl/>Periodic Freed                                    0<nl/>Internal Freed                                84070
12/21/2019 04:15:57,spid107,Unknown,Memory Broker Clerk (Column store object pool)      Pages<nl/>---------------------------------------- ----------<nl/>Total                                      21670985<nl/>Simulated                                   2875695<nl/>Simulation Benefit                                0<nl/>Internal Benefit                                  0<nl/>External Benefit                                  0<nl/>Value Of Memory                                   0<nl/>Periodic Freed                                    0<nl/>Internal Freed                                84070
12/21/2019 04:23:20,spid94,Unknown,Memory Broker Clerk (Column store object pool)      Pages<nl/>---------------------------------------- ----------<nl/>Total                                      21660293<nl/>Simulated                                   2892211<nl/>Simulation Benefit                       0.0000000000<nl/>Internal Benefit                                  0<nl/>External Benefit                                  0<nl/>Value Of Memory                                   0<nl/>Periodic Freed                                    0<nl/>Internal Freed                                84070

well, well...


Memory Broker Clerk (Column store object pool)
Time               Pages            kb
03:15:35           34670319         277362552
03:17:51           34670319         277362552
03:24:14           34670319         277362552
03:36:41           34670319         277362552
03:43:01           34670319         277362552
03:47:00           34670319         277362552
03:50:43           34670740         277365920
03:54:08           34639426         277115408
03:56:07           34639426         277115408
03:58:37           34639426         277115408
04:00:43           34639426         277115408
04:03:27           34639437         277115496
04:05:45           34639437         277115496
04:09:38           34639440         277115520
04:15:57           21670985         173367880
04:23:20           21660293         173282344

a haw haw haw...

Monday, May 13, 2019

SQL Server 2017: here a NUMA, there a NUMA... Part 1

aka Performance Bamboozle

*****
This blog post considers a perf/scale testing system.  See a following blog post for similar concerns from a SQL Server 2016 production system.
SQL Server 2016: Here a NUMA, there a NUMA... Part 2
https://sql-sasquatch.blogspot.com/2019/05/sql-server-2016-here-numa-there-numa.html
*****

Let's observe a workload on SQL Server 2017 CU13, running on a 4x24 vcpu VM with 900 GB vRAM. [Max server memory] is set to 750 GB.  From 5:00 am to 12:30 pm [target server memory] is equal to [max server memory]; below I will refer to [target] only.


The yellow box marked in the graphs below is unusual.  Although CPU utilization generally trends with both active requests and parallel workers in the [default] workload group, CPU utilization is far lower in the yellow box than predicted by the number of active requests or parallel workers.  The end of the yellow box coincided with an intervention step.  My quick-thinking colleague Joe Obbish issued a [dbcc dropcleanbuffers] and the recovery was nothing short of miraculous.  But certainly that's not an operation to execute frequently on a busy system.  I'll be referring to the yellow box as a "performance bamboozle" for the remainder of this blog post.  I've gotta do something to keep myself amused.  What went wrong - and why did [dbcc dropcleanbuffers] help?


Only two DOP 8 queries ran for the majority of the yellow box.  Lets compare their Query Store details to those of similar queries with the same query_hash values.  All eight of the query executions detailed in the following 2 result sets ran at DOP 8; the particular queries of interest are highlighted in red.

Wow.  All 8 queries returned a single row.  All 8 had similar CPU ms, physical reads, logical reads, tempdb use, query memory use. But those two highlighted in red had elapsed time roughly 20 to 30 times that of the other queries. What happened?


The workers for these queries spent the majority of the yellow box time in sleep_task wait.  Often sleep_task is often ignored as a benign wait.

Read more about sleep_task waits in the
SQLSkills SQL Server Wait Type Library
https://www.sqlskills.com/help/waits/sleep_task/

Though perfmon includes details of several wait types in [\SQLServer:Wait Statistics(*)\*], sleep_task is not among them.

But perfmon offers other evidence of what was happening in those 2 queries.  Check out those free list stalls!!


The free list stalls call to mind the instance-wide perfmon counter [\SQLServer:Memory Manager\Free Memory (KB)].

SQL Server [total] memory is comprised of three categories: [database cache], [stolen], [free].

Just in case someone out there loves a little perfmon math as much as I do...

  [\SQLServer:Memory Manager\Database Cache Memory (KB)]
+ [\SQLServer:Memory Manager\Stolen Server Memory (KB)]
+ [\SQLServer:Memory Manager\Free Memory (KB)]
= [\SQLServer:Memory Manager\Total Server Memory (KB)]


It seems fairly intuitive that [\SQLServer:Memory Manager\Free Memory (KB)] would be pretty low when free list stalls are occurring.  And indeed that's what is seen in the graph below:the high plateau of free list stalls occurs during a valley of SQLOS free memory.


On this 4 vNUMA node vm, perfmon counters [\SQLServer:Memory Node(*)\Free Node Memory (KB)] will account for the portion of [\SQLServer:Memory Manager\Free Memory (KB)] on each SQLOS node.  The graph below shows that (although every now and then a stray errant value shows up in the individual node values).


The changes in free memory across the SQLOS nodes almost seem to predict something...


OK, let's look at the [\SQLServer:Memory Node(*)\Database Node Memory (KB)] counters.
Interesting that almost no database cache is listed on node 002 during the performance bamboozle.


When looking at [Stolen] memory in the next graph, something doesn't quite add up.  Some memory in the instance is being double-counted by SQLOS: counted on one node as [db cache] and on another as [stolen].  I've blogged about that briefly in the following two blog posts.

SQL Server 2016 Memory Accounting: A Suspicious Surprise 
http://sql-sasquatch.blogspot.com/2018/07/sql-server-2016-memory-accounting.html 

SQL Server 2016 Memory Accounting Part II: Another Suspicious Example
http://sql-sasquatch.blogspot.com/2018/10/sql-server-2016-memory-accounting-part.html

The massive amount of [stolen] memory on node 002 makes sense given the almost complete lack of [Db Cache] on node 002. It still looks kind of unusual.


~~~~~

Now, when free list stalls occur, one way to replenish the free lists is for clean buffer pool pages to be evicted by the lazy writer thread(s). Page writes can make clean pages out of dirty pages 🙂

So, when free list stalls occur, I expect to see page writes coming out of SQL Server.  But there weren't many page writes during this performance bamboozle.  Lazy writer wrote out a few pages.  Notice that as lazy writer wrote pages, the number of free list stalls slightly decreased. Checkpoint writes occurred up to the start of the performance bamboozle.  But not during.

There were no background writer writes, because the active databases were using automatic checkpoints rather than indirect checkpoints.


The slow pace of page writes contributed to the performance bamboozle. Or perhaps share a common underlying cause.

Note especially the second large bout of free list stalls at approximately 10:15 am.  During that round of free lists stalls, SQL Server page writes and lazy writer writes were plentiful.  That's how I expect the system to respond to free list stalls.

The [dbcc dropcleanbuffers] that Joe initiated to end the performance bamboozle was able to do something that the lazywriter was not able to do.  It broke a logjam, freeing up a bunch of memory within SQL Server [total] memory and allowing the lazywriter threads to get back to normal work.

~~~~~~~~~~

Many may already be familiar with the exceptional behavior shown in the next graph.  [Target server memory] is not as often enforced for SQL Server [total] memory as it used to be.  Batch mode columnstore queries especially seem prone to make [total] exceed [target].  This behavior is not unique to systems with multiple NUMA nodes; it can also be seen when there is a single SQLOS memory node.

Notice that [total] exceeds [target] almost immediately after the yellow box below, in addition to other times in the graph..


Description of [total] exceeding [target] can be seen in the following KB article, with a screenshot excerpt following.

Memory configuration and sizing considerations in SQL Server 2012 and later versions
https://support.microsoft.com/en-us/help/2663912/memory-configuration-and-sizing-considerations-in-sql-server-2012-and


For various reasons, I do not consider [total] > [target] to be a contributor to the performance bamboozle.  Rather, the brief time that [total] exceeded [target] after the performance bamboozle was a part of SQL Server recovering to normal behavior.

~~~~~~~~~~

The graph below shows this instance also experienced persistent and gradually accumulating [foreign] memory in the SQLOS memory nodes.  Fluctuation in the amount of [foreign] memory is somehow related to [total] exceeding [target].  This behavior is unique to systems with multiple NUMA nodes and multiple SQLOS memory nodes.


The persistent and accumulating [foreign] memory, similar to [total] > [target] does not seem to have been a contributor to the performance bamboozle.  Rather, the increase in total 


~~~~~~~~~~

At 9:31:07 top level memory blocks were allocated.


Harshdeep Singh discusses the role of top level memory blocks in maintaining free lists in the following blog post.

An In-depth look at memory – SQL Server 2012/2014
https://blogs.msdn.microsoft.com/sqljourney/2015/04/27/an-in-depth-look-at-memory-sql-server-20122014/

Late(r than expected) allocation of top level memory blocks may have contributed to the performance bamboozle.


Q.



Monday, July 2, 2018

SQL Server 2016 Memory Accounting: A Suspicious Surprise

Originally published 2018 July 2
Updated 2020 December 15
*****
I wanted to update this blog post with a link to a fix that corrects the memory double-counting described here (and the condition that leads to it).

KB4536005 - Improvement: Fix incorrect memory page accounting that causes out-of-memory errors in #SQLServer #SQLServer 2019 CU2 #SQLServer 2017 CU20 #SQLServer 2016 SP2 CU15
*****

Wading through all of the SQL Server memory-related perfmon counters to understand how they related to each other took me a really long time.  Time-series graphs that show the relationship help me tremendously, and when I started trying to account for SQL Server memory years ago I couldn't find any.  So I started to blog some time-series graphs, under the theory that either my understanding was correct and my graphs would be helpful to someone... or they'd be wrong and someone would correct me.
Well... its been about 5 years and my graphs haven't generated too much discussion, but they've really helped me 😀😀😀

Perfmon: SQL Server Database pages + Stolen pages + Free pages = Total pages
http://sql-sasquatch.blogspot.com/2013/09/perfmon-database-pages-stolen-pages.html

Working with SQL Server 2016 and some demanding ColumnStore batch mode workloads, I began to see suspicious numbers, and graphs that didn't make sense to me.  Today I got pretty close to figuring it out so I wanted to share what I've learned.

The following graphs are from a 4x10 physical server running Windows and SQL Server.  Four sockets, 4 NUMA nodes.

Perfmon has SQL Server "total" memory numbers for each SQLOS memory node, in addition to the instance-level measure.  The sum of "total node" memory across the nodes should be equal to the instance measure of "total server" memory.  That checks out.


 Database cache, free memory, and stolen memory report measures at the instance level and at the SQLOS memory node level.  Let's check out the instance measures first.  The sum of these categories should be "total server memory".  That checks out, too.


Now, since we've got instance measures of database cache, stolen, and free memory at the SQLOS memory node level as well, we can check whether they sum to "total node memory" on their respective nodes.

Uh oh.  I smell trouble...


Hey!! Trouble on this node too...


SQLOS node 001 also shows a suspicious graph...


Not to be left behind, SQLOS node 000 also shows an unexpected graph.


OK.  So either some memory is being counted multiple times... or some memory is being lost by the SQL Server memory manager and not reflected in "total node memory" and "total server memory".  Maybe I can narrow down the problem space.

Lets start by looking at Free Memory.


That graph above looks pretty good, even though it is pretty volatile.  Lets zoom in a little bit just to make sure.  The graph below makes me pretty confident - the node level "free memory" measures and the instance level "free memory" measures are aligned.


OK, since free memory accounting seems to agree between SQLOS nodes and the instance level measure, lets look at database cache.  The graph below shows that the instance measure aligns nicely with the node measures.


That leaves just Stolen Memory.  Take a look at the graph... and... yep, there's the problem.  Or at least there's a problem.


Having seen that Stolen Memory and only Stolen Memory indicates a discrepancy between the instance measure and the sum of the node measures, lets consider again the memory position on SQLOS memory node 002.  The sum of free + stolen + database is nearly 50GB greater than total node memory for an hour!  When there is not much stolen memory in that SQLOS memory node at all!!


Just to clarify what I mean by "not much stolen memory at all" on node 002...

[yeah, i name my excel workbook tabs "perfmon" and "graphs".  i use RC style format.  and its not unusual for my perfmon tabs to have over 1000 columns.]


Now... if I graph the difference between the sum of node-level stolen memory and instance-level stolen memory...


Now what if I sum database cache, stolen and free memory across all 4 SQLOS nodes and subtract the instance-level Total Server memory? Lets lay that - in transparent red - on top of the blue we just graphed.


So here's what I think is happening: in some cases of batchmode queries, a portion of memory is getting double-counted.  Its counted in one SQLOS memory node as "database cache" and in another memory node as "stolen memory"!!  That leads to the discrepancy seen here for instance and memory node measures - in stolen memory, and in total memory.

At this point i'm not sure if this represents a performance and scalability problem, or if it just masks some problems by making memory state and trends more difficult to accurately observe.  When i learn more about this, i'll blog an update post and link the two together.

Ciao for now!

[for another example of this condition, from a 2 vNUMA node VM please see the later blog post below]

SQL Server 2016 Memory Accounting Part II: Another Suspicious Example
https://sql-sasquatch.blogspot.com/2018/10/sql-server-2016-memory-accounting-part.html