In the DIY section of this post I added an explanation about the up-to-five second delay between creation of the column store object pool memory broker clerk, and the update to [Target pages]. I also added some modified code with built in WAITFOR '00:00:06' between each operation and checking the memory counters :-) That always gives the desired results... but wow waiting ~36 seconds for it to complete seems like it takes forever.
Have you ever looked at how the Microsoft Docs describe [\SQLServer:Buffer Manager\Target pages]?
There's not much there. As of 2021 December 6:
That's not much to go on. And I'm a very inquisitive individual.
So much so that I wrote 3 posts (so far) about this issue.
The second post:
sql.sasquatch: #SQLServer Database Cache Memory Magic at SQLOS Node Level -- Chaotic or Even A Little Bit Sinister (sql-sasquatch.blogspot.com)
https://sql-sasquatch.blogspot.com/2021/12/sqlserver-database-cache-memory-magic.html
The third post:
sql.sasquatch: #SQLServer - Database Cache Suppression (sql-sasquatch.blogspot.com)
https://sql-sasquatch.blogspot.com/2021/12/sqlserver-database-cache-suppression.html
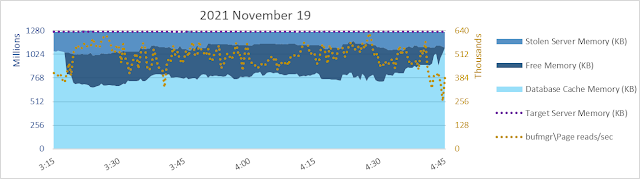
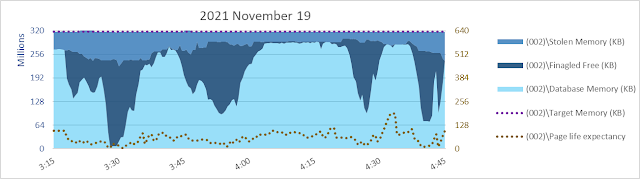
When I saw the memory graph below for a SQL Server 2017 system, my interest was piqued.
Lots of database pages were being read into cache as seen in the graph below, and there isn't any seeming correlation between the page read rate and the size of database cache. Hmmm.
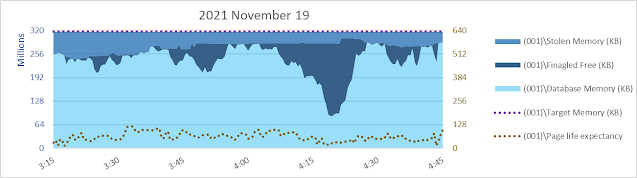
Database page reads are usually the major cause of inflow into database cache, and as such are a primary driver (together with database cache size) of the calculated [\SQLServer:Buffer Manager\Page life expectancy] counter. Considering the graphs immediately above and below, as one would expect, at a given page read rate PLE is higher when database cache is larger.
Given the database page read rate and PLE as seen above, why would SQL Server choose to amass and maintain for long periods of time ~30% of [Total Server Memory] as [Free Memory]? Especially since it has to constrain [Database Cache Memory] to about 50% of [Total Server Memory] to do that?
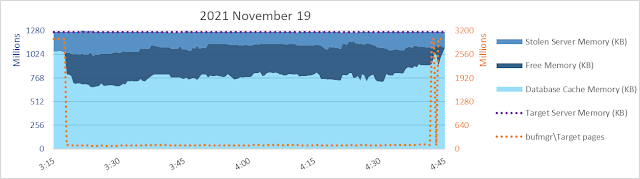
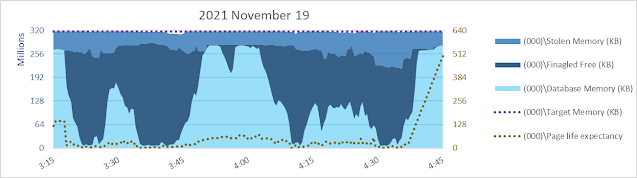
Sure enough, our friend [\SQLServer:Buffer Manager\Target pages] seems to be involved. The maximum value of the measure in orange below, against the Y-axis on the right, is 2456027136 pages. With 8 kb pages, that works out to 18738 gb. That's an awful lot since [Max Server Memory] is pretty close to 1024 gb. This system is a vm with 1200 gb vRAM.
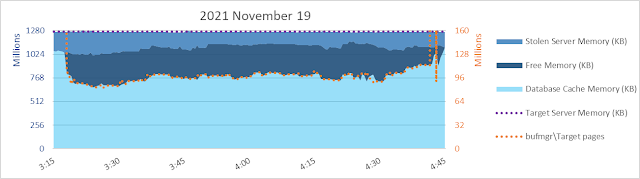
What if I change the ratio between the left Y-axis and the right Y-axis? The unit of measure on the left is kb, and on the right it's 8 kb pages. So what happens if I use an 8:1 ratio for the measures? Same maximum of 1280 million for the left Y-axis. But instead of 3000 million as a maximum on the right Y-axis, a maximum of 160 million.
Yeah, that's better! Suddenly [\SQLServer:Buffer Manager\Target pages] at the low end has a much more intuitive relatonship with the database cache size. Now [Target pages] is better predictive of database cache size, when it's NOT equal to 2456027136 pages. :-)
So, what event or condition can lead to such a drastic change in [\SQLServer:Buffer Manager\Target pages], with such significant consequences for database cache size? For now, I only know of one event that changes [Target pages] from a seemingly too-high-to-be-achieved number, to an achievable number which *may* result in a database cache being artificially constrained in size on a given system: creation and presence of the column store object pool memory broker clerk.
The buffer pool memory broker clerk is ever-present in a SQL Server instance. But the column store object pool memory broker clerk is a Houdini-kinda thing. It doesn't get created until buffer pages for a columnstore segment are read and need to be serialized into the object pool. Writing to or reading from delta stores isn't sufficient to create or sustain the column store object pool. Using an index reorganize on delta store contents only to compress a new columnstore row group won't do it. Bulk insert of over 102400 rows with sufficient memory grant to immediately compress into a new rowgroup - nope, that won't create or sustain the column store object pool memory broker clerk, either. Have to read buffer pool pages for a columnstore segment. And once there are no more buffer pool pages in the buffer pool... poof! That Houdini-like column store object pool memory broker disappears! And [\SQLServer:Buffer Manager\Target pages] returns from a maybe-reasonable, maybe-too-restricted value to an unachievable-on-this-system value.
Maybe there's another event or condition that can cause this Jeckyll-Hyde transformation. I don't know of one yet, but I'll keep searching, and asking.
Maybe you'd like to try this yourself? You can, on SQL Server 2017 or 2019. (Pretty sure this'll have similar results on SQL Server 2016 and 2022, but I've not verified that.)
Here are some screenshots, and all the code is down at the bottom of the post.
Don't do it in a production instance, please :-) Make sure there isn't an existing column store object pool when you try this, and that potential columnstore work from others while you do this doesn't affect your results. An instance where you are the only user, immediatelu after a clean shutdown and restart should work well. If you're the only user, checkpoint and dropcleanbuffers or freesystemcache for columnstore object pool should get you to a clean memory slate to start.
Here's the T-SQL query I use to get a quick lookie-loo at memory right after I start up the SQL Server instance. Notice there is no column store object pool memory broker clerk. Not just zero in size - the row doesn't exist in the DMV - hence my LOJ to the DMV on 1=1 just to report the NULL size. Look at the comparison between [Max Server Memory] in kb and [Target pages] in kb! This is my laptop, so MSM is set to 4 gb. That [Target pages] value! 258998272 kb works out to 247 gb. Not gonna get that on my laptop :-)
After verifying that column store object pool didn't exist, I used the code below to get one.
I actually checked after each step: creating the table, inserting 1000 row into delta store, reading 1000 rows from delta store, reorg to compress the delta store into a rowgroup. Each of those steps showed I still didn't have a column store object pool in the instance. And [Target pages] remained at an unattainable number.
Finally, I read the table contents from the columnstore compressed rowgroup. And that created the memory broker clerk. And brought [Target pages] down from the stratosphere, to a number that could actually be achieved on this system (and thus could serve as a reasonable target). The target of 3695216 kb is just a hair over 88% of the max server memory value of 4 gb or 4194304 kb.
As I mentioned earlier, there may be other events or conditions that can cause this type of shift in [Target pages]. I don't know of any, yet. But I'll update this post when I learn of some.
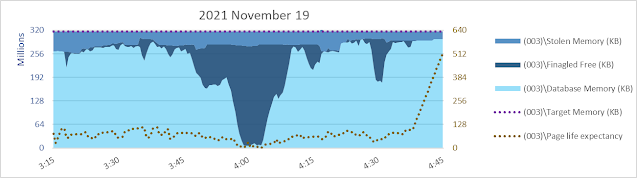
I have some concerns on both sides of that major change in [Target pages], actually. The really high value is great at making the database cache aggressive, and keeping free memory to a minimum in the instance. But - does it make SQL Server reluctant to shrink the database cache when it could in order to bring [Total Server Memory] back down to [Target Server Memory] after SQL Server has "colored outside the lines"? I think it might. Also, while allowing the database cache to remain aggressive in using up nearly all free memory is very good for PLE, the pressure on internal memory use within [Total Server Memory] may be causing unnecessary delays or CPU usage. For example, if there's little-to-no free memory while a sort or hash is executing and memory needs to be stolen against the query's workspace memory grant, it would seem to be better to have some free memory around than to have to scrounge for it.
On the other hand, restricting database cache for what seems to be a fixed amount of free memory in some cases can lead to inefficient use of memory. I definitely think that was the case in the graphs above, where free memory was over 396 gb at 7:30 am, when the read rate was over 240000 pages/s (1.8 gigabytes/s) and PLE ranged between 4 and 24. A second concern is how evenly distributed memory freeing activity is across SQLOS nodes (this topic deserves at least a full post on its own, if not a series).
Anyway... here's the code I used in my little DIY above :-)
; WITH
	msm(max_server_memory__kb) AS
(	SELECT CONVERT(INT, value_in_use) * 1024 FROM sys.configurations
	WHERE name			= 'max server memory (MB)')
,	tgt(target_pages__kb) AS
(	SELECT cntr_value * 8 FROM sys.dm_os_performance_counters
	WHERE counter_name	= 'Target Pages')
,	bpool(bpool__kb) AS
(	SELECT total_kb FROM sys.dm_os_memory_broker_clerks
	WHERE clerk_name	= 'Buffer Pool')
,	cs(csopool__kb) AS
(	SELECT total_kb FROM sys.dm_os_memory_broker_clerks
	WHERE clerk_name	= 'Column store object pool')
SELECT *, vers = @@version
FROM msm CROSS JOIN tgt CROSS JOIN bpool LEFT OUTER JOIN cs ON 1 = 1;

CREATE TABLE lonely_cci (c1 INT, INDEX cci__lonely_cci CLUSTERED COLUMNSTORE);
/*	no change in [Target Pages], no cso pool broker clerk yet */

INSERT INTO lonely_cci
SELECT TOP (1000) ROW_NUMBER() OVER (ORDER BY (SELECT NULL))
FROM master..spt_values;
/*	only 1000 rows inserted, so into delta store
	no change in [Target Pages], no cso pool broker clerk yet */

SELECT cnt = COUNT(*) FROM lonely_cci;
/*	reading from delta store
	no change in [Target Pages], no cso pool broker clerk yet */

ALTER INDEX cci__lonely_cci ON lonely_cci REORGANIZE WITH (COMPRESS_ALL_ROW_GROUPS = ON);
/*	the reorg compresses the delta store into a columnstore rowgroup
	no change in [Target Pages], no cso pool broker clerk yet */

SELECT cnt = COUNT(*) FROM lonely_cci;
/*	reading from the bpool pages associated with the first CCI rowgroup
	initializes the column store object pool memory broker clerk
	and serializes the memory contents of the bpool pages into the pool

	now [Target Pages] is a value reflective/directive of bpool size
	and the object pool memory broker clerk shows up in dm_os_memory_broker_clerks */


/*	-- any of the following will result in eviction of the rowgroup's bpool pages from bpool
	-- once there are no bpool pages for any columnstore segment in the bpool
	--		[Target Pages] returns to a value much greater
	--			than [Max Server Memory] or [Target Server Memory]
	--		column store object pool memory broker clerk disappears
	--			from dm_os_memory_broker_clerks
	CHECKPOINT; DBCC DROPCLEANBUFFERS WITH no_infomsgs;
	DBCC FREESYSTEMCACHE('Column store object pool') WITH no_infomsgs;
	TRUNCATE TABLE lonely_cci;
	DROP TABLE lonely_cci; */
***** Update 2021 December 7 *****
The [Target pages] counter is only updated every ~5 seconds. I don't know if the operational value is changed faster than that with shared memory for counter retrieval only updated every ~5 seconds? Or maybe the Resource Monitor has a ~5 second schedule for actually updating the operational value for [Target pages]? I *think* the operational value is updated immediately and shared memory only updated every ~5 seconds - that's the pattern I've seen with counters related to Resource Governor Workload Group requests completed/second and similar perfmon counters, too.
When I used:
WAITFOR DELAY '00:00:05'
after each operation and before checking [Target pages], there were still occasional misses of the updated value (eg there was a non-NULL size reported for column store object pool memory broker clerk but [Target pages] was still the same too-big value as when the broker clerk did not exist). By waiting 6 seconds after each operation before checking I always saw [Target pages] updated as expected: when column store object pool broker clerk existed, [Target pages] was less than [Max Server Memory] (and less than [Target Server Memory]); when column store broker clerk did not exist, [Target pages] was much larger than [Max Server Memory].
Here's some modified code including the WAITFOR DELAY '00:006' if you want to just run the durn thing in one go :-) It completes in ~36 seconds but it feels like forever before it finishes :-)
CREATE OR ALTER PROCEDURE #memcheck @step NVARCHAR(30) = 'no comment' AS
WAITFOR DELAY '00:00:06';
; WITH
	msm(max_server_memory__kb) AS
(	SELECT CONVERT(INT, value_in_use) * 1024 FROM sys.configurations
	WHERE name			= 'max server memory (MB)')
,	ser(target_server__kb) AS
(	SELECT cntr_value FROM sys.dm_os_performance_counters
	WHERE counter_name	= 'Target Server Memory (KB)')
,	buf(target_pages__kb) AS
(	SELECT cntr_value * 8 FROM sys.dm_os_performance_counters
	WHERE counter_name	= 'Target pages')
,	bpool(bpool__kb) AS
(	SELECT total_kb FROM sys.dm_os_memory_broker_clerks
	WHERE clerk_name	= 'Buffer Pool')
,	cs(csopool__kb) AS
(	SELECT total_kb FROM sys.dm_os_memory_broker_clerks
	WHERE clerk_name	= 'Column store object pool')
SELECT capture_tm = SYSDATETIME(), target_pages__diy_operation = @step, *, vers = LEFT(@@version, PATINDEX('%(KB%', @@version) - 2)
FROM msm CROSS JOIN ser CROSS JOIN buf CROSS JOIN bpool LEFT OUTER JOIN cs ON 1 = 1;
GO
DROP TABLE IF EXISTS #diy__target_pages;
CREATE TABLE #diy__target_pages
(	capture_tm					DATETIME2
,	target_pages__diy_operation	NVARCHAR(40)
,	max_server_memory__kb		BIGINT
,	target_server__kb			BIGINT
,	target_pages__kb			BIGINT
,	bpool__kb					BIGINT
,	csopool__kb					BIGINT
,	vers						NVARCHAR(40)
,	INDEX cci__diy__target_pages CLUSTERED (capture_tm)) WITH (DATA_COMPRESSION = ROW);


DROP TABLE IF EXISTS #lonely_cci;
CREATE TABLE #lonely_cci (c1 INT, INDEX cci__lonely_cci CLUSTERED COLUMNSTORE);
INSERT INTO #diy__target_pages EXEC #memcheck N'cci created';
INSERT INTO #lonely_cci SELECT TOP (1000) ROW_NUMBER() OVER (ORDER BY (SELECT NULL)) FROM master..spt_values;
INSERT INTO #diy__target_pages EXEC #memcheck N'delta store insert';
IF (SELECT COUNT(*) FROM #lonely_cci) = 1 PRINT 'nope';
INSERT INTO #diy__target_pages EXEC #memcheck N'delta store select';
ALTER INDEX cci__lonely_cci ON #lonely_cci REORGANIZE WITH (COMPRESS_ALL_ROW_GROUPS = ON);
INSERT INTO #diy__target_pages EXEC #memcheck N'reorg';
IF (SELECT COUNT(*) FROM #lonely_cci) = 1 PRINT 'nope';
INSERT INTO #diy__target_pages EXEC #memcheck N'compressed select';
DROP TABLE #lonely_cci; /* see comment below about ways to get rid of column store object pool memory broker clerk */
INSERT INTO #diy__target_pages EXEC #memcheck N'drop table';
SELECT * FROM #diy__target_pages ORDER BY capture_tm ASC;
/*	-- any of the following will result in eviction of the rowgroup's bpool pages from bpool
	-- once there are no bpool pages for any columnstore segment in the bpool
	--		[Target Pages] returns to a value much greater
	--			than [Max Server Memory] or [Target Server Memory]
	--		column store object pool memory broker clerk disappears
	--			from dm_os_memory_broker_clerks
	CHECKPOINT; DBCC DROPCLEANBUFFERS WITH no_infomsgs;
	DBCC FREESYSTEMCACHE('Column store object pool') WITH no_infomsgs;
	TRUNCATE TABLE #lonely_cci;
	DROP TABLE #lonely_cci; */
And this was the result when I ran that code on my lil ol' laptop.
Happy holidays!
***** End Update December 7 *****