Showing posts with label half-baked draft. Show all posts

Saturday, September 30, 2017

SQL Server - estimates outside of the histogram - half-baked draft

Gonna pull together lots of stuff about cardinality estimates outside of the stats histogram here.  It'll take me a while...
 
SQL Server keeps track of how many inserts and deletes since last stats update – when the number of inserts/deletes exceeds the stats update threshold the next time a query requests those stats it’ll qualify for an update.  Trace flag 2371 alters the threshold function before SQL Server 2016. With 2016 compatibility mode, the T2371 function becomes default behavior.  Auto-stats update and auto-stats update async settings of the database determine what happens once the stats qualify for an update.  But whether an auto-stats update or a manual stats update, the density, histogram, etc are all updated.

Trace flags 2389, 2390, 4139, and the ENABLE_HIST_AMENDMENT_FOR_ASC_KEYS hint operate outside the full stats framework, bringing in the quickstats update.  They have slightly different scope in terms of which stats qualify for quickstats updates – but in each case its *only* stats for indexes, not stats for non-indexed columns that can qualify.  After 3 consecutive stats updates on an index, SQL Server “brands” the stats type as ascending or static, until then it is branded ‘unknown’. The brand of a stat can be seen by setting trace flag 2388 at the session level and using dbcc show_statistics.

T2389 – Introduced in SQL Server 2005 SP1. quickstats update for stats branded ‘ascending’.  Finds just the current max value, and density together with max value is used for estimate outside of histogram range.  Histogram itself is not persistently amended.
T2390 – Introduced in SQL Server 2005 SP1. quickstats update for stats branded ‘unknown’.  Finds current max value for stats branded ‘unknown’, as above.
T4139 – First available in SQL Server 2012 & 2014, released in the CU stream for each.  A significant gap left with T2389 and T2390 is a case where an index stat has been branded ‘static’ based on its update pattern, even though over the longterm trend the highest value is ascending.  In fact, if more than 10% of the edits to an index between stats updates are *within* the histogram range rather than 90%+ above the histogram range, it may be marked as static.  So, with trace flag 4139 an index can qualify for a quickstats update regardless of its brand.  Trace flag 4139 supersedes and exceeds T2389 & T2390 in that manner.  
ENABLE_HIST_AMENDMENT_FOR_ASC_KEYS – This hint was introduced in SQL Server 2016 SP1.  It functions as trace flag 4139 does, but it can only be applied at the query level while trace flag 4139 can be enabled globally.

There are additional details, such as which indexes types are disqualified from quickstats updates, and when and how the new CE handles ascending keys and/or responds to the trace flags and hint.  But this might already be more than you wanted

https://support.microsoft.com/af-za/help/922063/fix-you-may-notice-a-large-increase-in-compile-time-when-you-enable-tr

Tuesday, September 19, 2017

#SQLServer 2016 SP1 CU4 vs CU2: Deep Sleepers and a Nervous Waker in the Deadzone

We got a deadzone in SQL Server 2016 SP1 CU4.  A small amount of testing on SQL Server 2016 SP1 CU3 indicates the deadzone behavior was introduced in CU4 and not earlier.  Rather than re-generate a bunch of stuff I have from CU2 in CU3, though, for the sake of me finally getting something more info about this scenario into the blog-o-sphere, I'll be comparing the behavior of SP1 CU4 to SP1 CU2 here.

The deadzone... for hours, four deep sleepers and one nervous waker for a MAXDOP 2 query try to get it out... usually they do.  But it can take hours... sometimes days.

My current theory as to what is happening: for some reason, the deadlock monitor is prompting the wrong producer at the exchange to spill.  That producer wakes up... can't spill... so goes immediately back to sleep.  After some indeterminate amount of time, the deadlock monitor finally prompts the right producer to spill - one that *can* spill.  It does spill, and then the query progresses.  What leads to the change in which thread gets kicked by the deadlock monitor to spill?  I don't know... and not sure I can determine that without access to source code.

 *****

Joe Obbish used a heading of "Putting the Dead in Deadlock" in his related blog post... I'm so impressed with that turn of phrase I have to try some of my own. :-) Joe's post is here...

Hash Partitioned Exchange Spills
https://orderbyselectnull.com/2017/09/15/hash-partitioned-exchange-spills/

And there is a Connect item...
Order Preserving Repartition Streams Can Cause Extreme Performance Degradations
https://connect.microsoft.com/SQLServer/feedback/details/3141119/order-preserving-repartition-streams-can-cause-extreme-performance-degradations

Let's start this adventure the way I started it: by looking at some frustrating behavior on SQL Server 2016 SP1 CU4. Below is the setup, followed by the troubled query.  The table created in the setup is as simple as it gets: single column BIGINT, in a clustered index.  13890 zeroes inserted, followed by 13890 ones.  Update stats on the clustered index before the first attempt at producing an egregious hang, so every execution is on a level playing field. Trace flag 8649 is used here so cost doesn't prevent a parallel plan.  Hint the merge join to get order-preserving exchanges.  The same problem occurs at higher DOP than 2... but when investigating a problem with parallel queries, I recommend working with the lowest DOP where the behavior can be reproduced for the sake of simplicity.

/* the setup: drop/create a single BIGINT column table w/CI
              populate the table with 13890 0s and 13890 1s */ 
DROP TABLE IF EXISTS DEADLOCK_6_L
CREATE TABLE DEADLOCK_6_L(ID BIGINT);
CREATE CLUSTERED INDEX CI__DEADLOCK_6_L ON DEADLOCK_6_L(ID);

INSERT INTO DEADLOCK_6_L SELECT 0 FROM
(SELECT TOP (13890) row_number() over(order by (select null)) RN
 FROM master..spt_values t1 CROSS JOIN master..spt_values t2) subQ;

INSERT INTO DEADLOCK_6_L SELECT 1 FROM
(SELECT TOP (13890) row_number() over(order by (select null)) RN
 FROM master..spt_values t1 CROSS JOIN master..spt_values t2) subQ;

UPDATE STATISTICS DEADLOCK_6_L(CI__DEADLOCK_6_L) WITH FULLSCAN;

/* might take up to 20 repetitions of the query below 
   to get exchange spill (CU2) or "the deadzone" (CU4) */ 

SELECT * FROM DEADLOCK_6_L t1 WHERE EXISTS
(SELECT 1 FROM DEADLOCK_6_L t2 WHERE t2.ID = t1.ID)
ORDER BY t1.ID OPTION (querytraceon 8649, merge join, maxdop 2);

I've run the setup and the trouble query in a user database with 8 equally-sized data files, and in a single-file master database, with the same results.  When the query is fast... its fast.  But when its slow, it can take hours to complete.  Sometimes days.

Here's live query stats from an example - in fact one that's running as I'm typing in this post.


As I was running these tests, I made sure that "live query stats" and "include actual plan" were toggled on for my session.  So sys.dm_exec_query_profiles info was available for the session.


Whew!!  That one finally completed. 21 hours, 16 minutes, 10 seconds as reported by SSMS.


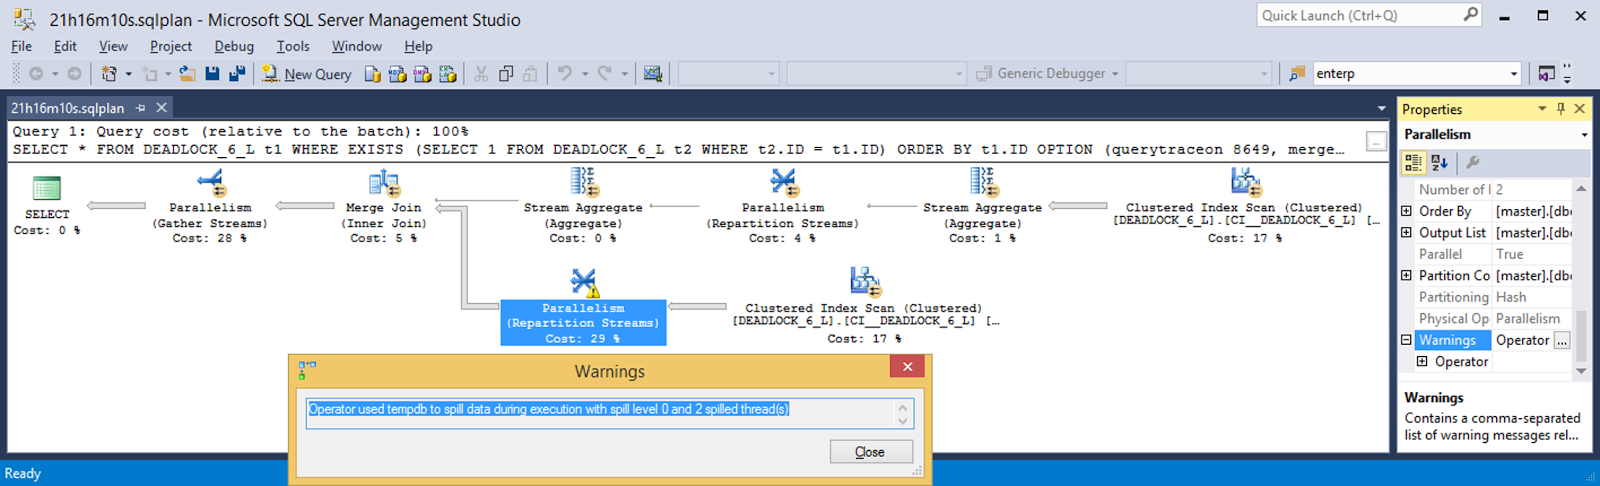
Lets take a look at that post-execution plan for clues.  There's a warning on the Repartition Streams - what's it say?


OK, what about the waits recorded by the post-execution plan?  Huh. That's a total of only 176 ms of wait time. 4071 ms of CPU time.  And 76569190 ms of elapsed time (21h16m9s190ms).  That doesn't add up in any way, shape, or form. 


What does sys.dm_exec_session_wait_stats say?  *That* makes more sense.  306270624 ms of CXPACKET wait time.  85h6m30s624ms among the 5 threads that last long enough to be observed.


Wednesday, August 24, 2016

Windows Guest: VMware Perfmon metrics intermittently missing?

I'm using logman to collect Windows, SQL Server, and VMware metrics in a csv file(30 second intervals).

Not sure what's causing the sawtooth pattern below.  I thought it was a timekeeping problem on the ESXi host, now not so sure.

See this Ryan Ries blog post for what may be a similar issue, caused by clock sync of guest with ESXi host.
https://www.myotherpcisacloud.com/post/Mystery-of-the-Performance-Counters-with-Negative-Denominators!
But that is also a reversal of the problem somewhat.  In that case, guest metrics were returning -1.  In my case, its the VMware metrics (passed through from the host) that are missing.

The same pattern for "Host processor speed in MHz" adds to the mystery.
If only "Effective VM Speed in MHz" was missing, I'd chalk it up to a possible arithmetic issue, with a negative denominator resulting from time skew between guest and host.
But... "Host processor speed in MHz" should be a constant 2600 in this case.  Maybe somehow its still calculated with a time interval, and time skew can screw it up?

For now, I've got a loop running on this VM logging local time, and using NET TIME to retrieve time from another VM as well.  That's turned up variations, but it seems to be variations of up to 5 seconds in contacting the other VM rather than large time skew between the VMs.

Guess I'll see what turns up...

*****
So far this is the closest I've found.  Similar problem reported - no resolution.

"Windows VM perfmon counters - VM Processor"
https://communities.vmware.com/thread/522281