This blog post is under construction...
This blog post is part of a series started yesterday with the post linked immediately below.SQL Server 2017 cu17 ColumnStore Workload OOMs Part 1
https://sql-sasquatch.blogspot.com/2020/04/sql-server-2017-cu17-columnstore.html
Error investigation can be informed by one of two paradigms:
I think of the first paradigm as "whoever smelt it, dealt it."
The second paradigm is "the bearer of bad news."
Sometimes to reach the correct conclusion, the events and surrounding timeline must be examined from both viewpoints.
Whoever Smelt It, Dealt It
This article provided some needed laughter yesterday when I read it. Its not directly relevant to the matter at hand... but its worth a chuckle.We Asked Scientists Whether He Who Smelt It Really Dealt It
https://www.vice.com/en_us/article/ypa5x5/we-asked-scientists-whether-he-who-smelt-it-really-dealt-it
What the heck does this sophomoric idea have to do with OOMs, or any error type?
Consider this simplistic example. The error is a direct result of the action by this session. This session's action alone was sufficient to warrant the "divide by zero" error message.
This session smelt the error message, because this session dealt the divide by zero.

As it relates to OOMs, consider the OOM described in this blog post.
SQL Server 2019 Scalar UDF inlining - OOM in some cases
https://sql-sasquatch.blogspot.com/2019/11/sql-server-2019-udf-inlining-oom-in.html
A single session in isolation executing a query with an ugly UDF that triggers UDF inlining is sufficient to consume enough [Optimizer Memory] to result in the OOMs described in the post. Yes, its a (fixed in CU2) bug, but the activity by that individual session realizes the risk presented by the bug. That session smelt it by way of the OOM, after that session dealt it by using an ugly inlined UDF.
OK. Now let's focus on the OOMs I'm currently dealing with. In SQL Server, if an OOM can be properly described as "whoever smelt it, dealt it" the memory activity must be attributable to the session that received the error and only that session.
One way for that to be the case is for that session to be running in isolation - no other user sessions on the instance. That's not the case in observations of the OOMs I'm concerned with. Each occurrence of these OOMs happens to be when there are multiple concurrent user sessions.
Another way for the memory activity to be attributable to the specific session that received the error is if the memory type is specifically and solely allocated to the session. Connection memory works like that. Connection memory is within [Total Server Memory] but individual sessions have private access to small chunks of it. Optimizer memory works that way, too. So, too, does the used portion of query memory grants. All of the memory in [Total Server Memory] that can be individually attributed to sessions is within [Stolen Server Memory]. But not all [Stolen Server Memory] can be individually attributed to sessions. (For example, consider the plan cache within [Stolen Server Memory]. Although an individual session inserts a plan into cache, while the plan is cached other sessions can use it. And a cached plan can stay in cache after the session that originally inserted it has ended.)
It just so happens I have some graphs. Each of the red vertical lines below is an OOM. Usually in a graph like this I have [Stolen Server Memory] at the top of the stacked graph, with [Free Memory] and [Database Cache Memory] below it. Like this...

But since I want to focus on [Stolen Server Memory] I want it at the bottom of the stack for now, like this...
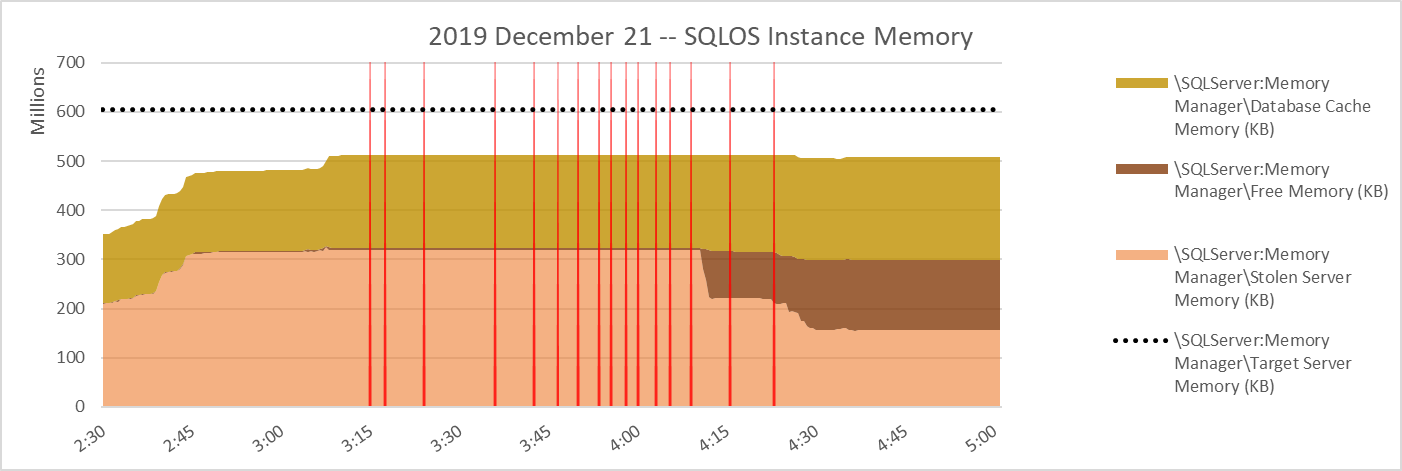
In the workloads I am concerned with, the largest portion of individually attributable [Stolen Server Memory] is the amount of granted query memory that is used for sort/hash/columnstore compression at any given time. If all user workload groups are associated with the Default Resource Pool, that amount is [\SQLServer:Memory Manager\Granted Workspace Memory (KB)] - [\SQLServer:Memory Manager\Reserved Server Memory (KB)]. If user Resource Pools other than Default during the timeperiod of concern, the information should be gathered from sys.dm_exec_query_memory_grants and/or sys.dm_exec_query_resource_semaphores to account for the total granted and total reserved memory.
Fortunately for me, on this day the only resource pools present were Default and Internal. A little bit easier path.
The next graph is the amount of granted memory (not necessarily already used), with [\SQLServer:Memory Manger\Total Server memory (KB)] included on the same graph for scale.
First of all, I'll point out that the total granted memory is not very high compared to the target server memory. Also, the yellow box indicates high points for granted memory that occurred without errors, while errors occurred later with lower levels of granted memory.

Let's zoom in a little for better visibility. This graph is granted memory - but it doesn't indicate how much of the granted memory is used.

Because on the Default resource pool was in play, layering the reserved memory in front of granted memory gives an idea of the used query memory. In the graph below, the exposed dark green is the portion of [\SQLServer:Memory Manager\Granted Workspace Memory (KB)] which is used.
well, well...

well, well....

Date,Source,Severity,Message
12/21/2019 03:15:35,spid83,Unknown,Memory Broker Clerk (Column store object pool)      Pages<nl/>---------------------------------------- ----------<nl/>Total                                      34670319<nl/>Simulated                                    166692<nl/>Simulation Benefit                                0<nl/>Internal Benefit                                  0<nl/>External Benefit                                  0<nl/>Value Of Memory                                   0<nl/>Periodic Freed                                    0<nl/>Internal Freed                                    0
12/21/2019 03:17:51,spid79,Unknown,Memory Broker Clerk (Column store object pool)      Pages<nl/>---------------------------------------- ----------<nl/>Total                                      34670319<nl/>Simulated                                    166692<nl/>Simulation Benefit                                0<nl/>Internal Benefit                                  0<nl/>External Benefit                                  0<nl/>Value Of Memory                                   0<nl/>Periodic Freed                                    0<nl/>Internal Freed                                    0
12/21/2019 03:24:14,spid51,Unknown,Memory Broker Clerk (Column store object pool)      Pages<nl/>---------------------------------------- ----------<nl/>Total                                      34670319<nl/>Simulated                                    166692<nl/>Simulation Benefit                                0<nl/>Internal Benefit                                  0<nl/>External Benefit                                  0<nl/>Value Of Memory                                   0<nl/>Periodic Freed                                    0<nl/>Internal Freed                                    0
12/21/2019 03:36:41,spid73,Unknown,Memory Broker Clerk (Column store object pool)      Pages<nl/>---------------------------------------- ----------<nl/>Total                                      34670319<nl/>Simulated                                    166692<nl/>Simulation Benefit                                0<nl/>Internal Benefit                                  0<nl/>External Benefit                                  0<nl/>Value Of Memory                                   0<nl/>Periodic Freed                                    0<nl/>Internal Freed                                    0
12/21/2019 03:43:01,spid89,Unknown,Memory Broker Clerk (Column store object pool)      Pages<nl/>---------------------------------------- ----------<nl/>Total                                      34670319<nl/>Simulated                                    166692<nl/>Simulation Benefit                                0<nl/>Internal Benefit                                  0<nl/>External Benefit                                  0<nl/>Value Of Memory                                   0<nl/>Periodic Freed                                    0<nl/>Internal Freed                                    0
12/21/2019 03:47:00,spid55,Unknown,Memory Broker Clerk (Column store object pool)      Pages<nl/>---------------------------------------- ----------<nl/>Total                                      34670319<nl/>Simulated                                    166692<nl/>Simulation Benefit                                0<nl/>Internal Benefit                                  0<nl/>External Benefit                                  0<nl/>Value Of Memory                                   0<nl/>Periodic Freed                                    0<nl/>Internal Freed                                    0
12/21/2019 03:50:43,spid57,Unknown,Memory Broker Clerk (Column store object pool)      Pages<nl/>---------------------------------------- ----------<nl/>Total                                      34670740<nl/>Simulated                                    166692<nl/>Simulation Benefit                                0<nl/>Internal Benefit                                  0<nl/>External Benefit                                  0<nl/>Value Of Memory                                   0<nl/>Periodic Freed                                    0<nl/>Internal Freed                                    0
12/21/2019 03:54:08,spid73,Unknown,Memory Broker Clerk (Column store object pool)      Pages<nl/>---------------------------------------- ----------<nl/>Total                                      34639426<nl/>Simulated                                    250762<nl/>Simulation Benefit                                0<nl/>Internal Benefit                                  0<nl/>External Benefit                                  0<nl/>Value Of Memory                                   0<nl/>Periodic Freed                                    0<nl/>Internal Freed                                84070
12/21/2019 03:56:07,spid73,Unknown,Memory Broker Clerk (Column store object pool)      Pages<nl/>---------------------------------------- ----------<nl/>Total                                      34639426<nl/>Simulated                                    250762<nl/>Simulation Benefit                                0<nl/>Internal Benefit                                  0<nl/>External Benefit                                  0<nl/>Value Of Memory                                   0<nl/>Periodic Freed                                    0<nl/>Internal Freed                                84070
12/21/2019 03:58:37,spid73,Unknown,Memory Broker Clerk (Column store object pool)      Pages<nl/>---------------------------------------- ----------<nl/>Total                                      34639426<nl/>Simulated                                    250762<nl/>Simulation Benefit                                0<nl/>Internal Benefit                                  0<nl/>External Benefit                                  0<nl/>Value Of Memory                                   0<nl/>Periodic Freed                                    0<nl/>Internal Freed                                84070
12/21/2019 04:00:43,spid52,Unknown,Memory Broker Clerk (Column store object pool)      Pages<nl/>---------------------------------------- ----------<nl/>Total                                      34639426<nl/>Simulated                                    250762<nl/>Simulation Benefit                                0<nl/>Internal Benefit                                  0<nl/>External Benefit                                  0<nl/>Value Of Memory                                   0<nl/>Periodic Freed                                    0<nl/>Internal Freed                                84070
12/21/2019 04:03:27,spid70,Unknown,Memory Broker Clerk (Column store object pool)      Pages<nl/>---------------------------------------- ----------<nl/>Total                                      34639437<nl/>Simulated                                    250718<nl/>Simulation Benefit                                0<nl/>Internal Benefit                                  0<nl/>External Benefit                                  0<nl/>Value Of Memory                                   0<nl/>Periodic Freed                                    0<nl/>Internal Freed                                84070
12/21/2019 04:05:45,spid74,Unknown,Memory Broker Clerk (Column store object pool)      Pages<nl/>---------------------------------------- ----------<nl/>Total                                      34639437<nl/>Simulated                                    250718<nl/>Simulation Benefit                                0<nl/>Internal Benefit                                  0<nl/>External Benefit                                  0<nl/>Value Of Memory                                   0<nl/>Periodic Freed                                    0<nl/>Internal Freed                                84070
12/21/2019 04:09:38,spid70,Unknown,Memory Broker Clerk (Column store object pool)      Pages<nl/>---------------------------------------- ----------<nl/>Total                                      34639440<nl/>Simulated                                    250706<nl/>Simulation Benefit                                0<nl/>Internal Benefit                                  0<nl/>External Benefit                                  0<nl/>Value Of Memory                                   0<nl/>Periodic Freed                                    0<nl/>Internal Freed                                84070
12/21/2019 04:15:57,spid107,Unknown,Memory Broker Clerk (Column store object pool)      Pages<nl/>---------------------------------------- ----------<nl/>Total                                      21670985<nl/>Simulated                                   2875695<nl/>Simulation Benefit                                0<nl/>Internal Benefit                                  0<nl/>External Benefit                                  0<nl/>Value Of Memory                                   0<nl/>Periodic Freed                                    0<nl/>Internal Freed                                84070
12/21/2019 04:23:20,spid94,Unknown,Memory Broker Clerk (Column store object pool)      Pages<nl/>---------------------------------------- ----------<nl/>Total                                      21660293<nl/>Simulated                                   2892211<nl/>Simulation Benefit                       0.0000000000<nl/>Internal Benefit                                  0<nl/>External Benefit                                  0<nl/>Value Of Memory                                   0<nl/>Periodic Freed                                    0<nl/>Internal Freed                                84070
well, well...
Memory Broker Clerk (Column store object pool)
Time               Pages            kb
03:15:35           34670319         277362552
03:17:51           34670319         277362552
03:24:14           34670319         277362552
03:36:41           34670319         277362552
03:43:01           34670319         277362552
03:47:00           34670319         277362552
03:50:43           34670740         277365920
03:54:08           34639426         277115408
03:56:07           34639426         277115408
03:58:37           34639426         277115408
04:00:43           34639426         277115408
04:03:27           34639437         277115496
04:05:45           34639437         277115496
04:09:38           34639440         277115520
04:15:57           21670985         173367880
04:23:20           21660293         173282344
a haw haw haw...


