CREATE OR ALTER PROCEDURE scheduler_px_worker__report AS BEGIN ;WITH tasks AS (SELECT ot.scheduler_id, ot.session_id, ot.exec_context_id FROM sys.dm_os_tasks ot JOIN sys.dm_exec_requests er ON ot.session_id = er.session_id AND ot.exec_context_id > 0) SELECT t.scheduler_id, os.parent_node_id, spid__exec_context_id = STRING_AGG(CONVERT(VARCHAR(4), t.session_id) + ':' + CONVERT(VARCHAR(4), t.exec_context_id), ', ') WITHIN GROUP (ORDER BY t.session_id, t.exec_context_id) FROM tasks t JOIN sys.dm_os_schedulers os ON t.scheduler_id = os.scheduler_id GROUP BY os.parent_node_id, t.scheduler_id ORDER BY os.parent_node_id, t.scheduler_id; END
Thursday, April 15, 2021
A little something for exploring placement of SQL Server Parallel Workers
Wednesday, September 23, 2020
SQL Server 2016++, checkdb/checktable, and trace flags 2549 & 2562
TL;dr
Trace flag 2549 is no longer required for checkdb or
checktable in SQL Server 2016++.
Trace flag 2562 may still benefit checkdb on a system (depends on disk characteristics and tempdb) in SQL Server 2016++, but is not expected to benefit checktable due to the already-limited scope of checktable activity.
~~~~~~~~~~~~~
Trace flags 2549 and 2562 were introduced in kb2634571, linked below.
2549 - by default checkdb (and checktable) before SQL Server
2016 planned its concurrent disk IO per Windows drive letter, in order to
achieve a reasonable pace without overloading disk subsystems.
The problem came in for systems using mount points.
One system might put SQL Server data files on 8 Windows volumes as eight
separate drive letters. Another system could put the data files on 8 Windows
volumes under a single drive letter, using mount points.
The system with eight separate drive letters would experience
much higher concurrent disk traffic from checkdb/checktable than the system
with a single drive letter. And if that system could handle the higher
disk IO pace, checkdb/checktable would perform better on that system.
Trace flag 2549 was introduced to even the playing field - increasing the pace of checkdb/checktable disk io for systems using mountpoints. This was done by planning the disk IO per database file, rather than per drive letter.
In SQL Server 2016, there were changes to components used by
checkdb/checktable explained in the second link below that make trace flag 2549
no longer needed. The second link below describes MultiObjectScanner vs CheckScanner (introduced in SQL Server 2016).
2562 - by default, checkdb groups the heaps and b-tree
indexes into batches of up to 512 for its activity.
With trace flag 2562 enabled, checkdb puts all heaps and
b-tree indexes into a single batch.
This trace flag often speeds the performance of checkdb with
physical_only on systems using hard drive storage (by minimizing disk head
traffic and lowering average disk read service times).
However tempdb is a serious consideration for this trace
flag when checkdb is running without physical_only (when logical checks are
run).
Tempdb use for logical checks increases until the batch of
heaps and b-tree indexes is complete. Watching tempdb use by checkdb on a
system with many batches, tempdb use can be seen to increase as each batch
runs, then drop with the start of another batch.
If all heaps and b-tree indexes are in a single batch due to
trace flag 2562, tempdb use increases until checkdb is complete.
Another consideration with trace flag 2562: a single nonpartitioned table will not require more than one batch, it will already fit in a single batch.
So trace flag 2562 is not expected to effect the operation of
checktable.
Improvements for the DBCC CHECKDB command may result in faster performance when you use the PHYSICAL_ONLY option
SQL 2016 - It Just Runs Faster: DBCC Scales 7x Better
Friday, September 18, 2020
SQL Server 2019 - the strangest thing happened on the way to my cardinality estimate
Well - I know a few. Was trace flag 4199 globally enabled on 2012? Yep. And on 2016? Database Compat level 2016, and optimizer hotfixes enabled in database scoped configuration.
Ok. Well, in SQL Server 2012 they were using the Legacy CE because it was the only one around. How about on SQL Server 2016? Legacy CE enabled in database scoped configuration.
Oh.
How about ascending key? Trace flag 4139 was globally enabled in SQL Server 2012. And in SQL Server 2016? Yep, globally enabled there, too.
Trace flag 4138 to disable row goal adjustments has sometimes made a huge difference. I didn't mention it yet, though. Better to see an affected plan first. And once I saw an affected plan... well, it really didn't look like trace flag 4138 could help, either. The bad plan was all nested loop joins, filters, parallelism operators and compute scalar operators. By adding a HASH JOIN hint, the plan looked more familiar to my colleague and query performance went back to the few seconds normally expected. But the developers wanted to understand the regression, and if possible avoid adding the hint to dozens or maybe even more than a hundred queries.
That was just about the end of my quick-n-easy list. For good measure my colleague checked what happened to the plan with SQL Server 2012 compat level: no substantive change. And with the default CE: no substantive change.
I started staring at statistics. Maybe some very important, very popular stats had fallen prey to extremely unlucky samples.
I became very suspicious when I noticed that a fairly important auto-created statistics object was on a varchar(66) column. But the query used integer values for that column heavily in the query predicate.
Sure 'nuf, the range_high_values were all integers, but because the column was varchar, the range_high_keys were dictionary sorted. That always makes me kinda suspicious.
And in that original query plan, a three million row table was pushed through a filter with a row estimate of 1 coming out. That's very suspicious.
So for several hours I tested various hinky ideas.
And finally, late on a Friday night, I think I discovered the problem. I won't know for sure until Monday when similar tests can be run on-site against their data on a SQL Server 2016 and 2012 system. But... even if this isn't *that* problem, it is *a* problem and its present in SQL Server 2019 CU6.
Time for show and tell. This work is being done in SQL server 2019 CU6.
Let's create a simple 3 column table. Each of the columns are varchar data type. Create statistics on col1. Populate the table with 50,000 rows. The first column col1 gets populated with integers from 9900 to 14900, in multiples of 100. Then let's update statistics.
CREATE TABLE [dbo].[stats_test4]( [col1] [varchar](66) NOT NULL, [fluff] [varchar](4200) NULL, [col2] [varchar](66) NOT NULL ) ON [PRIMARY]; CREATE STATISTICS stats_test4__col1 ON stats_test4(col1); ;with nums as (select top (1000) n = row_number() over (order by (select null)) from master..spt_values) , recur as (select top (50) n = row_number() over (order by (select null)) from master..spt_values) , fluff as (select z = replicate('Z', 4100)) insert into stats_test4 select 10000 + 100 * (nums.n % 50 - 1), fluff.z, 1 from nums cross join recur cross join fluff; UPDATE STATISTICS stats_test4(stats_test4__col1);
Here's what the statistics look like... there are 47 steps and only 26 of them are in the picture below... but the last 21 are boring anyway.
Let's generate an estimated plan for a query with an IN list in the WHERE clause. These two examples are with the legacy cardinality estimator. There are 19 integer members of that IN list. You can see the implicit conversion warning on the SELECT operator below. Column col1 is varchar(66), but it is being evaluated against a list of integer values. That filter operator is where the relevant action is right now. An estimate of almost 16000 rows is fine by me.
But the world is not enough. Nineteen integers? How about 20?
With 20 integers in the IN list, the estimate at the filter drops from nearly 16000 to... 1.
The downstream effects can easily be that desired hash joins become loop joins due to low row estimates.
Now let's see what happens with default cardinality estimator. Let's start with a single integer IN list.
An estimate of 1000.
And with two integers in the IN list the estimate is at 1492.47.
The decreasing rate of growth is the work of exponential backoff...
Here's 4 integers...
Certainly there are other details surrounding this issue. I'll be back to fill in more as I learn more. In particular on Monday I should be able to transplant what I've learned in SQL Server 2019 to some on-site 2012 and 2016 databases. That should conclusively indicate whether this is part of the current bad stew... or something I should remember for the future when I run into it again.
*** Update 2020 October 10 ***
With additional testing, we learned that in SQL Server 2012 RTM this behavior did not occur: we tested up to 40 elements in the IN list and the estimate did not yet drop to 1.
I don't expect Microsoft to continue *enhancing* the legacy cardinality estimator. This could be considered a performance regression, and if the organization were interested they could push for a change. I'd expect, even if they were successful, the change to likely only appear in SQL Server 2019. They've decided rather to change their code where applicable so that literal values in OR clauses or IN lists are provided in matching data type to the relevant column, avoiding the implicit conversion and also avoiding this potentially disastrous performance implication after the cliff at 19/20 elements.
Friday, September 11, 2020
SQL Server snapshot db temporary stats - created or updated
For a great introduction to this topic, please see this post at SQLSkills from Joe Sack.
Temporary Statistics for Database Snapshots in SQL Server 2012
https://www.sqlskills.com/blogs/joe/temporary-statistics-for-database-snapshots-in-sql-server-2012/
Today's test instance is running SQL Server 2019 CU6.
OK, let's create a test database.
USE [master]
GO CREATE DATABASE [snap_test_src] CONTAINMENT = NONE ON PRIMARY ( NAME = N'snap_test_src', SIZE = 8192KB , MAXSIZE = UNLIMITED, FILEGROWTH = 65536KB , FILENAME = N'C:\Program Files\Microsoft SQL Server\MSSQL15.MSSQLSERVER\MSSQL\DATA\snap_test_src.mdf') LOG ON ( NAME = N'snap_test_src__log', SIZE = 8192KB , MAXSIZE = 2GB , FILEGROWTH = 65536KB , FILENAME = N'C:\Program Files\Microsoft SQL Server\MSSQL15.MSSQLSERVER\MSSQL\DATA\snap_test_src__log.ldf') ALTER DATABASE [snap_test_src] SET AUTO_CREATE_STATISTICS ON ALTER DATABASE [snap_test_src] SET AUTO_UPDATE_STATISTICS ON ALTER DATABASE [snap_test_src] SET AUTO_UPDATE_STATISTICS_ASYNC OFF ALTER DATABASE [snap_test_src] SET ANSI_NULL_DEFAULT OFF ALTER DATABASE [snap_test_src] SET ANSI_NULLS OFF ALTER DATABASE [snap_test_src] SET ANSI_PADDING OFF ALTER DATABASE [snap_test_src] SET ANSI_WARNINGS OFF ALTER DATABASE [snap_test_src] SET ARITHABORT OFF ALTER DATABASE [snap_test_src] SET AUTO_CLOSE OFF ALTER DATABASE [snap_test_src] SET AUTO_SHRINK OFF ALTER DATABASE [snap_test_src] SET CURSOR_CLOSE_ON_COMMIT OFF ALTER DATABASE [snap_test_src] SET CURSOR_DEFAULT GLOBAL ALTER DATABASE [snap_test_src] SET CONCAT_NULL_YIELDS_NULL OFF ALTER DATABASE [snap_test_src] SET NUMERIC_ROUNDABORT OFF ALTER DATABASE [snap_test_src] SET QUOTED_IDENTIFIER OFF ALTER DATABASE [snap_test_src] SET RECURSIVE_TRIGGERS OFF ALTER DATABASE [snap_test_src] SET DISABLE_BROKER ALTER DATABASE [snap_test_src] SET DATE_CORRELATION_OPTIMIZATION OFF ALTER DATABASE [snap_test_src] SET TRUSTWORTHY OFF ALTER DATABASE [snap_test_src] SET ALLOW_SNAPSHOT_ISOLATION OFF ALTER DATABASE [snap_test_src] SET PARAMETERIZATION SIMPLE ALTER DATABASE [snap_test_src] SET READ_COMMITTED_SNAPSHOT OFF ALTER DATABASE [snap_test_src] SET HONOR_BROKER_PRIORITY OFF ALTER DATABASE [snap_test_src] SET RECOVERY FULL ALTER DATABASE [snap_test_src] SET PAGE_VERIFY CHECKSUM ALTER DATABASE [snap_test_src] SET DB_CHAINING OFF ALTER DATABASE [snap_test_src] SET FILESTREAM( NON_TRANSACTED_ACCESS = OFF ) ALTER DATABASE [snap_test_src] SET TARGET_RECOVERY_TIME = 60 SECONDS ALTER DATABASE [snap_test_src] SET DELAYED_DURABILITY = DISABLED ALTER DATABASE [snap_test_src] SET QUERY_STORE = OFF ALTER DATABASE [snap_test_src] SET READ_WRITE ALTER DATABASE [snap_test_src] SET MULTI_USER
USE snap_test_src; CREATE TABLE stats_test(col1 INT NOT NULL, col2 INT NOT NULL); ;WITH num AS (SELECT TOP (1000) n = ROW_NUMBER() OVER (ORDER BY (SELECT NULL)) FROM master..spt_values) INSERT INTO stats_test SELECT n, 1001 - n FROM num;
SELECT * FROM stats_test where col1 < 3;
SELECT ss.name, ss.stats_id, ss.auto_created, ss.user_created, ss.is_temporary , sp.last_updated FROM snap_test_src.sys.stats ss CROSS APPLY snap_test_src.sys.dm_db_stats_properties(ss.object_id, ss.stats_id) sp WHERE ss.object_id = object_id('stats_test');
USE snap_test_src; ;WITH num AS (SELECT TOP (1000) n = ROW_NUMBER() OVER (ORDER BY (SELECT NULL)) FROM master..spt_values) INSERT INTO stats_test SELECT n, 1001 - n FROM num;
CREATE DATABASE snap_test ON ( NAME = snap_test_src, FILENAME = 'C:\Program Files\Microsoft SQL Server\MSSQL15.MSSQLSERVER\MSSQL\DATA\snap_test_src.ss') AS SNAPSHOT OF snap_test_src;
USE snap_test SELECT * FROM stats_test WHERE col1 < 3 AND col2 > 998;
SELECT ss.name, ss.stats_id, ss.auto_created, ss.is_temporary , sp.last_updated FROM snap_test.sys.stats ss CROSS APPLY snap_test.sys.dm_db_stats_properties(ss.object_id, ss.stats_id) sp WHERE ss.object_id = object_id('stats_test');
USE snap_test SELECT ss.name, source_rows = sp2.rows, source_sample = sp2.rows_sampled , snap_rows = sp.rows, snap_sample = sp.rows_sampled FROM snap_test.sys.stats ss CROSS APPLY snap_test.sys.dm_db_stats_properties(ss.object_id, ss.stats_id) sp OUTER APPLY snap_test_src.sys.dm_db_stats_properties(ss.object_id, ss.stats_id) sp2 WHERE ss.object_id = object_id('stats_test');
Friday, April 17, 2020
SQL Server 2017 cu17 Columnstore Workload OOMs Part 2: Whoever Smelt It, Dealt It?
This blog post is under construction...
This blog post is part of a series started yesterday with the post linked immediately below.SQL Server 2017 cu17 ColumnStore Workload OOMs Part 1
https://sql-sasquatch.blogspot.com/2020/04/sql-server-2017-cu17-columnstore.html
Error investigation can be informed by one of two paradigms:
I think of the first paradigm as "whoever smelt it, dealt it."
The second paradigm is "the bearer of bad news."
Sometimes to reach the correct conclusion, the events and surrounding timeline must be examined from both viewpoints.
Whoever Smelt It, Dealt It
This article provided some needed laughter yesterday when I read it. Its not directly relevant to the matter at hand... but its worth a chuckle.We Asked Scientists Whether He Who Smelt It Really Dealt It
https://www.vice.com/en_us/article/ypa5x5/we-asked-scientists-whether-he-who-smelt-it-really-dealt-it
What the heck does this sophomoric idea have to do with OOMs, or any error type?
Consider this simplistic example. The error is a direct result of the action by this session. This session's action alone was sufficient to warrant the "divide by zero" error message.
This session smelt the error message, because this session dealt the divide by zero.
As it relates to OOMs, consider the OOM described in this blog post.
SQL Server 2019 Scalar UDF inlining - OOM in some cases
https://sql-sasquatch.blogspot.com/2019/11/sql-server-2019-udf-inlining-oom-in.html
A single session in isolation executing a query with an ugly UDF that triggers UDF inlining is sufficient to consume enough [Optimizer Memory] to result in the OOMs described in the post. Yes, its a (fixed in CU2) bug, but the activity by that individual session realizes the risk presented by the bug. That session smelt it by way of the OOM, after that session dealt it by using an ugly inlined UDF.
OK. Now let's focus on the OOMs I'm currently dealing with. In SQL Server, if an OOM can be properly described as "whoever smelt it, dealt it" the memory activity must be attributable to the session that received the error and only that session.
One way for that to be the case is for that session to be running in isolation - no other user sessions on the instance. That's not the case in observations of the OOMs I'm concerned with. Each occurrence of these OOMs happens to be when there are multiple concurrent user sessions.
Another way for the memory activity to be attributable to the specific session that received the error is if the memory type is specifically and solely allocated to the session. Connection memory works like that. Connection memory is within [Total Server Memory] but individual sessions have private access to small chunks of it. Optimizer memory works that way, too. So, too, does the used portion of query memory grants. All of the memory in [Total Server Memory] that can be individually attributed to sessions is within [Stolen Server Memory]. But not all [Stolen Server Memory] can be individually attributed to sessions. (For example, consider the plan cache within [Stolen Server Memory]. Although an individual session inserts a plan into cache, while the plan is cached other sessions can use it. And a cached plan can stay in cache after the session that originally inserted it has ended.)
It just so happens I have some graphs. Each of the red vertical lines below is an OOM. Usually in a graph like this I have [Stolen Server Memory] at the top of the stacked graph, with [Free Memory] and [Database Cache Memory] below it. Like this...
But since I want to focus on [Stolen Server Memory] I want it at the bottom of the stack for now, like this...
In the workloads I am concerned with, the largest portion of individually attributable [Stolen Server Memory] is the amount of granted query memory that is used for sort/hash/columnstore compression at any given time. If all user workload groups are associated with the Default Resource Pool, that amount is [\SQLServer:Memory Manager\Granted Workspace Memory (KB)] - [\SQLServer:Memory Manager\Reserved Server Memory (KB)]. If user Resource Pools other than Default during the timeperiod of concern, the information should be gathered from sys.dm_exec_query_memory_grants and/or sys.dm_exec_query_resource_semaphores to account for the total granted and total reserved memory.
Fortunately for me, on this day the only resource pools present were Default and Internal. A little bit easier path.
The next graph is the amount of granted memory (not necessarily already used), with [\SQLServer:Memory Manger\Total Server memory (KB)] included on the same graph for scale.
First of all, I'll point out that the total granted memory is not very high compared to the target server memory. Also, the yellow box indicates high points for granted memory that occurred without errors, while errors occurred later with lower levels of granted memory.
Let's zoom in a little for better visibility. This graph is granted memory - but it doesn't indicate how much of the granted memory is used.
Because on the Default resource pool was in play, layering the reserved memory in front of granted memory gives an idea of the used query memory. In the graph below, the exposed dark green is the portion of [\SQLServer:Memory Manager\Granted Workspace Memory (KB)] which is used.
well, well...
well, well....
Date,Source,Severity,Message 12/21/2019 03:15:35,spid83,Unknown,Memory Broker Clerk (Column store object pool) Pages<nl/>---------------------------------------- ----------<nl/>Total 34670319<nl/>Simulated 166692<nl/>Simulation Benefit 0<nl/>Internal Benefit 0<nl/>External Benefit 0<nl/>Value Of Memory 0<nl/>Periodic Freed 0<nl/>Internal Freed 0 12/21/2019 03:17:51,spid79,Unknown,Memory Broker Clerk (Column store object pool) Pages<nl/>---------------------------------------- ----------<nl/>Total 34670319<nl/>Simulated 166692<nl/>Simulation Benefit 0<nl/>Internal Benefit 0<nl/>External Benefit 0<nl/>Value Of Memory 0<nl/>Periodic Freed 0<nl/>Internal Freed 0 12/21/2019 03:24:14,spid51,Unknown,Memory Broker Clerk (Column store object pool) Pages<nl/>---------------------------------------- ----------<nl/>Total 34670319<nl/>Simulated 166692<nl/>Simulation Benefit 0<nl/>Internal Benefit 0<nl/>External Benefit 0<nl/>Value Of Memory 0<nl/>Periodic Freed 0<nl/>Internal Freed 0 12/21/2019 03:36:41,spid73,Unknown,Memory Broker Clerk (Column store object pool) Pages<nl/>---------------------------------------- ----------<nl/>Total 34670319<nl/>Simulated 166692<nl/>Simulation Benefit 0<nl/>Internal Benefit 0<nl/>External Benefit 0<nl/>Value Of Memory 0<nl/>Periodic Freed 0<nl/>Internal Freed 0 12/21/2019 03:43:01,spid89,Unknown,Memory Broker Clerk (Column store object pool) Pages<nl/>---------------------------------------- ----------<nl/>Total 34670319<nl/>Simulated 166692<nl/>Simulation Benefit 0<nl/>Internal Benefit 0<nl/>External Benefit 0<nl/>Value Of Memory 0<nl/>Periodic Freed 0<nl/>Internal Freed 0 12/21/2019 03:47:00,spid55,Unknown,Memory Broker Clerk (Column store object pool) Pages<nl/>---------------------------------------- ----------<nl/>Total 34670319<nl/>Simulated 166692<nl/>Simulation Benefit 0<nl/>Internal Benefit 0<nl/>External Benefit 0<nl/>Value Of Memory 0<nl/>Periodic Freed 0<nl/>Internal Freed 0 12/21/2019 03:50:43,spid57,Unknown,Memory Broker Clerk (Column store object pool) Pages<nl/>---------------------------------------- ----------<nl/>Total 34670740<nl/>Simulated 166692<nl/>Simulation Benefit 0<nl/>Internal Benefit 0<nl/>External Benefit 0<nl/>Value Of Memory 0<nl/>Periodic Freed 0<nl/>Internal Freed 0 12/21/2019 03:54:08,spid73,Unknown,Memory Broker Clerk (Column store object pool) Pages<nl/>---------------------------------------- ----------<nl/>Total 34639426<nl/>Simulated 250762<nl/>Simulation Benefit 0<nl/>Internal Benefit 0<nl/>External Benefit 0<nl/>Value Of Memory 0<nl/>Periodic Freed 0<nl/>Internal Freed 84070 12/21/2019 03:56:07,spid73,Unknown,Memory Broker Clerk (Column store object pool) Pages<nl/>---------------------------------------- ----------<nl/>Total 34639426<nl/>Simulated 250762<nl/>Simulation Benefit 0<nl/>Internal Benefit 0<nl/>External Benefit 0<nl/>Value Of Memory 0<nl/>Periodic Freed 0<nl/>Internal Freed 84070 12/21/2019 03:58:37,spid73,Unknown,Memory Broker Clerk (Column store object pool) Pages<nl/>---------------------------------------- ----------<nl/>Total 34639426<nl/>Simulated 250762<nl/>Simulation Benefit 0<nl/>Internal Benefit 0<nl/>External Benefit 0<nl/>Value Of Memory 0<nl/>Periodic Freed 0<nl/>Internal Freed 84070 12/21/2019 04:00:43,spid52,Unknown,Memory Broker Clerk (Column store object pool) Pages<nl/>---------------------------------------- ----------<nl/>Total 34639426<nl/>Simulated 250762<nl/>Simulation Benefit 0<nl/>Internal Benefit 0<nl/>External Benefit 0<nl/>Value Of Memory 0<nl/>Periodic Freed 0<nl/>Internal Freed 84070 12/21/2019 04:03:27,spid70,Unknown,Memory Broker Clerk (Column store object pool) Pages<nl/>---------------------------------------- ----------<nl/>Total 34639437<nl/>Simulated 250718<nl/>Simulation Benefit 0<nl/>Internal Benefit 0<nl/>External Benefit 0<nl/>Value Of Memory 0<nl/>Periodic Freed 0<nl/>Internal Freed 84070 12/21/2019 04:05:45,spid74,Unknown,Memory Broker Clerk (Column store object pool) Pages<nl/>---------------------------------------- ----------<nl/>Total 34639437<nl/>Simulated 250718<nl/>Simulation Benefit 0<nl/>Internal Benefit 0<nl/>External Benefit 0<nl/>Value Of Memory 0<nl/>Periodic Freed 0<nl/>Internal Freed 84070 12/21/2019 04:09:38,spid70,Unknown,Memory Broker Clerk (Column store object pool) Pages<nl/>---------------------------------------- ----------<nl/>Total 34639440<nl/>Simulated 250706<nl/>Simulation Benefit 0<nl/>Internal Benefit 0<nl/>External Benefit 0<nl/>Value Of Memory 0<nl/>Periodic Freed 0<nl/>Internal Freed 84070 12/21/2019 04:15:57,spid107,Unknown,Memory Broker Clerk (Column store object pool) Pages<nl/>---------------------------------------- ----------<nl/>Total 21670985<nl/>Simulated 2875695<nl/>Simulation Benefit 0<nl/>Internal Benefit 0<nl/>External Benefit 0<nl/>Value Of Memory 0<nl/>Periodic Freed 0<nl/>Internal Freed 84070 12/21/2019 04:23:20,spid94,Unknown,Memory Broker Clerk (Column store object pool) Pages<nl/>---------------------------------------- ----------<nl/>Total 21660293<nl/>Simulated 2892211<nl/>Simulation Benefit 0.0000000000<nl/>Internal Benefit 0<nl/>External Benefit 0<nl/>Value Of Memory 0<nl/>Periodic Freed 0<nl/>Internal Freed 84070
well, well...
Memory Broker Clerk (Column store object pool) Time Pages kb 03:15:35 34670319 277362552 03:17:51 34670319 277362552 03:24:14 34670319 277362552 03:36:41 34670319 277362552 03:43:01 34670319 277362552 03:47:00 34670319 277362552 03:50:43 34670740 277365920 03:54:08 34639426 277115408 03:56:07 34639426 277115408 03:58:37 34639426 277115408 04:00:43 34639426 277115408 04:03:27 34639437 277115496 04:05:45 34639437 277115496 04:09:38 34639440 277115520 04:15:57 21670985 173367880 04:23:20 21660293 173282344
a haw haw haw...
Thursday, April 16, 2020
SQL Server 2017 cu17 ColumnStore Workload OOMs Part 1
Let's start the story with a SQL Server 2017 CU17 service restart on December 20, 2019.
All of the graphs below unless otherwise noted are from perfmon, captured in 30 second increments.
It's a VMware VM, with Windows Server 2016 as the operating system. Global startup trace flags 4199 (optimizer hotfixes), 4139 (quickstats histogram amendments), 3226 (no errorlog messages for successful t-log backups). Nothing too surprising there.
This vm has 56 vcpu and 620 GB vRAM.
[Max Server Memory] is set to 590000 mb.
12/20/2019 11:03:24,spid8s,Unknown,SQL Server shutdown has been initiated 12/20/2019 11:03:24,spid8s,Unknown,SQL Trace was stopped due to server shutdown. Trace ID = '1'. This is an informational message only; no user action is required. 12/20/2019 11:03:25,Server,Unknown,Microsoft SQL Server 2017 (RTM-CU17) (KB4515579) - 14.0.3238.1 (X64) <nl/> Sep 13 2019 15:49:57 <nl/> Copyright (C) 2017 Microsoft Corporation<nl/> Enterprise Edition: Core-based Licensing (64-bit) on Windows Server 2016 Standard 10.0 <X64> (Build 14393: ) (Hypervisor) 12/20/2019 11:03:25,Server,Unknown,UTC adjustment: -6:00 12/20/2019 11:03:25,Server,Unknown,(c) Microsoft Corporation. 12/20/2019 11:03:25,Server,Unknown,All rights reserved. 12/20/2019 11:03:25,Server,Unknown,Server process ID is 12764. 12/20/2019 11:03:25,Server,Unknown,System Manufacturer: 'VMware<c/> Inc.'<c/> System Model: 'VMware Virtual Platform'. 12/20/2019 11:03:25,Server,Unknown,Authentication mode is MIXED. 12/20/2019 11:03:25,Server,Unknown,Logging SQL Server messages in file 'C:\Program Files\Microsoft SQL Server\MSSQL14.MSSQLSERVER\MSSQL\Log\ERRORLOG'. 12/20/2019 11:03:25,Server,Unknown,The service account is '***redacted***'. This is an informational message; no user action is required. 12/20/2019 11:03:25,Server,Unknown,Registry startup parameters: <nl/> -d C:\Program Files\Microsoft SQL Server\MSSQL14.MSSQLSERVER\MSSQL\DATA\master.mdf<nl/> -e C:\Program Files\Microsoft SQL Server\MSSQL14.MSSQLSERVER\MSSQL\Log\ERRORLOG<nl/> -l C:\Program Files\Microsoft SQL Server\MSSQL14.MSSQLSERVER\MSSQL\DATA\mastlog.ldf<nl/> -T 4199<nl/> -T 4139<nl/> -T 3226 12/20/2019 11:03:25,Server,Unknown,Command Line Startup Parameters:<nl/> -s "MSSQLSERVER"
12/20/2019 11:03:25,Server,Unknown,SQL Server detected 28 sockets with 2 cores per socket and 2 logical processors per socket<c/> 56 total logical processors; using 56 logical processors based on SQL Server licensing. This is an informational message; no user action is required.
When [Max Server Memory] can be attained by SQL Server, [Target Server Memory] will be equal to [Max Server Memory]. If memory conditions external to SQL Server make [Max Server Memory] unattainable, [Target Server Memory] will be adjusted downward to an attainable value. As workload is placed on the system, [Total Server Memory] grows toward [Target Server Memory]. That's typical, expected behavior.
In this case, the story stays boring until after the following midnight. There wasn't enough workload to drive much growth of [Total Server Memory] until about 2:15 am, after which [Total Server Memory] grew fairly rapidly. [Total Server Memory] reached a plateau between 3:00 am and 3:15 am, and then stepped slightly down later. [Target Server Memory] was never attained. That's curious.
[Total Server Memory] is the sum of [Database Cache Memory], [Free Memory], and [Stolen Memory] for the instance. Here's a graph of those three memory categories over the same timeperiod.
It really is quite curious that [Total Server Memory] never reached [Target Server Memory] and in fact eventually backed *farther off* from [Target Server Memory]. If external factors made [Target Server Memory] unattainable, I expect [Target Server Memory] to be adjusted downward. But that didn't happen.
I'm a very curious guy, but I don't spend days worth of time creating and staring at graphs of the same short timeperiod simply out of curiosity. This morning timeperiod encompassed 16 SQL Server out-of-memory errors. I want to be able to diagnose them, and find out when the contributing behavior was introduced, in order to advise organizations that are planning SQL Server upgrades - or that fall prey to the type of OOMs experienced in this instance.
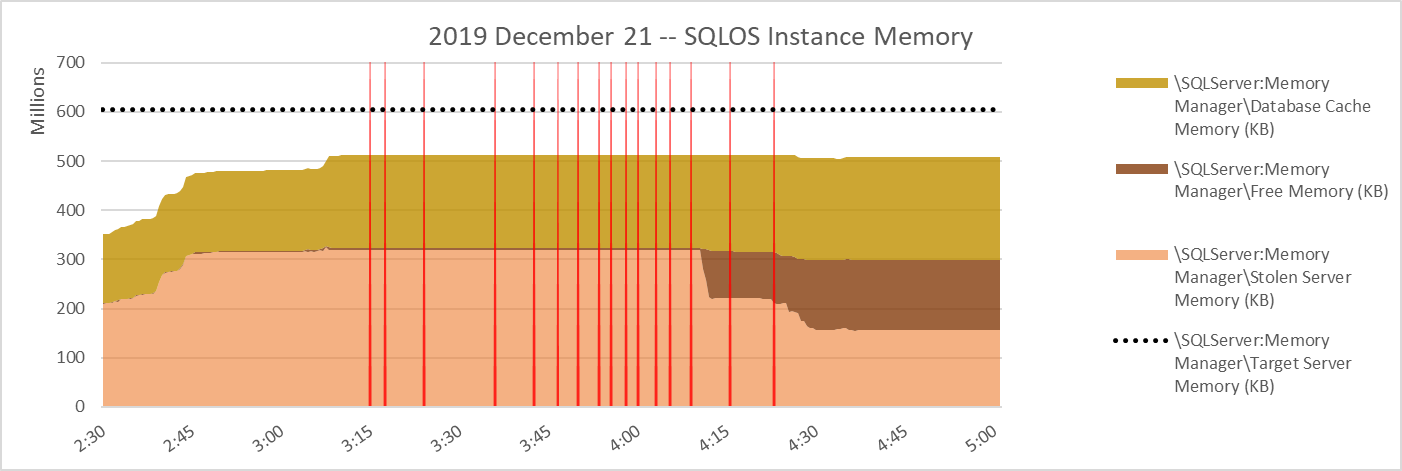
I'm going to tighten the timeframe for the remaining graphs to 2:30 am to 5:00 am, in order for the individual errors to be discernable on the graphs.
There are the 16 OOMs, each marked with a vertical red line in the graph below. Interestingly, they occur during the plateau of [Total Server Memory]. But... SQL Server is still a long way off from reaching [Target Server Memory]... why not just grow SQL Server's memory share?
In fact, the categories of [Database], [Stolen], and [Free] SQLOS memory can be tracked at SQLOS node level, too. Pretty nice balance on nodes 000 and 001.
Extracted from the SQL Server errorlog, here are the 16 OOMs from that night.
12/21/2019 03:15:27,spid83,Unknown,Failed to allocate BUFs: FAIL_BUFFER_ALLOCATION 1 12/21/2019 03:17:43,spid79,Unknown,Failed to allocate BUFs: FAIL_BUFFER_ALLOCATION 8 12/21/2019 03:24:02,spid51,Unknown,Failed to allocate BUFs: FAIL_BUFFER_ALLOCATION 8 12/21/2019 03:36:37,spid73,Unknown,Failed to allocate BUFs: FAIL_BUFFER_ALLOCATION 1 12/21/2019 03:42:54,spid89,Unknown,Failed to allocate BUFs: FAIL_BUFFER_ALLOCATION 1 12/21/2019 03:46:54,spid55,Unknown,Failed to allocate BUFs: FAIL_BUFFER_ALLOCATION 1 12/21/2019 03:50:36,spid57,Unknown,Failed to allocate BUFs: FAIL_BUFFER_ALLOCATION 1 12/21/2019 03:53:56,spid73,Unknown,Failed to allocate BUFs: FAIL_BUFFER_ALLOCATION 1 12/21/2019 03:55:57,spid73,Unknown,Failed to allocate BUFs: FAIL_BUFFER_ALLOCATION 1 12/21/2019 03:58:28,spid73,Unknown,Failed to allocate BUFs: FAIL_BUFFER_ALLOCATION 1 12/21/2019 04:00:39,spid52,Unknown,Failed to allocate BUFs: FAIL_BUFFER_ALLOCATION 1 12/21/2019 04:03:14,spid70,Unknown,Failed to allocate BUFs: FAIL_BUFFER_ALLOCATION 16 12/21/2019 04:05:34,spid74,Unknown,Failed to allocate BUFs: FAIL_BUFFER_ALLOCATION 1 12/21/2019 04:09:26,spid70,Unknown,Failed to allocate BUFs: FAIL_BUFFER_ALLOCATION 24 12/21/2019 04:15:44,spid107,Unknown,Failed to allocate BUFs: FAIL_BUFFER_ALLOCATION 8 12/21/2019 04:23:14,spid94,Unknown,Failed to allocate BUFs: FAIL_BUFFER_ALLOCATION 1
So here's the summary of the story: 16 OOMs occurred in one night. The instance hadn't reached [Target Server Memory], and there doesn't seem to be a good reason for [Total Server Memory] to *not* have grown rather than incur an OOM. There was over 50GB of FZPL per vNUMA node, for goodness sake! Memory use seems to have been quite evenly divided between the vNUMA nodes.
For the last two OOMs, at 4:15 am and 4:23 am, there was even a large amount of [Free] SQLOS memory within [Total Server Memory]. And there was plenty of [Free] SQLOS memory on either of the two SQLOS nodes!! The possibility of SQLOS [Total] memory growth at the time of any of the 16 OOMs, and the additional presence of significant SQLOS [Free] memory on either SQLOS node during the last 2 OOMs fully convinces me that this is a bug. (Well, that and not having seen this type of behavior in any of the SQL Server 2016 or 2019 versions I've worked with.)
When the dust clears from this, I think a bug similar to this one from SQL Server 2017 cu10 will be found. I am upset at myself that in 5 months of staring down *this* behavior, I haven't been able to marshal the resources to get *this* bug properly identified so it can be corrected.
FIX: Out of memory error occurs even when there are many free pages in SQL Server
https://support.microsoft.com/en-us/help/4347088/fix-out-of-memory-error-when-there-are-free-pages-in-sql-server
The fix referenced above, kb4347088, is found in SQL Server 2017 cu10 and SQL Server 2016 sp2 cu3. The problem described in this blog post shares some similarities, and has been observed on SQL Server 2017 cu17, cu18, and cu19. As of 2020 April 16 this bug has not been identified and there is no fix imagined or planned.
Sunday, December 15, 2019
Interpreting SQL Server 2019 DBCC MEMORYSTATUS output -- Part 1
In response to certain OOM conditions, SQL Server will automatically log DBCC MEMORYSTATUS output to the error log. Here I'll look at output from the command run via a task scheduler script on a 5 minute schedule.
One issue with the excerpt of the output below is the lack of units.
start Fri 12/13/2019 14:40:00.80 Process/System Counts Value ---------------------------------------------------- -------------------- Available Physical Memory 250846224384 Available Virtual Memory 136302950027264 Available Paging File 298663870464 Working Set 13835464704 Percent of Committed Memory in WS 99 Page Faults 6876485 System physical memory high 1 System physical memory low 0 Process physical memory low 0 Process virtual memory low 0 ~~~~~ end Fri 12/13/2019 14:40:06.62
Here's some info from perfmon.
| Time | 14:40:01 | 14:40:06 | 14:40:11 |
| \NUMA Node Memory(_Total)\Total MBytes | 952319 | 952319 | 952319 |
| \NUMA Node Memory(_Total)\Free & Zero Page List MBytes | 233635 | 233634 | 233634 |
| \NUMA Node Memory(_Total)\Available MBytes | 239222 | 239221 | 239229 |
| \Paging File(_Total)\% Usage | 0 | 0 | 0 |
MemoryStatus gives Available Physical Memory = 250846224384. Assuming that number is specified in bytes, dividing by 1048576 yields megabytes: 239225.6 mb. That's no more than 4.6 mb away from the 3 values for [\NUMA Node Memory(_Total)\Available MBytes] shown in the perfmon above.
Below "wmic pagefileset list" shows the lone pagefile with a size of 48000 mb. Perfmon above shows it at 0% used.
total_physical_memory_kb = 975175156 kb = 930 gb
available_physical_memory_kb = 243809076 kb = 238095 mb
total_page_file_kb = 1024327156 kb = 930 gb + 48000 mb
available_page_file_kb = 289622644 kb = 234835 mb + 48000 mb
So what have we got? MEMORYSTATUS [Available Physical Memory] measured in bytes appears to be the same resource as perfmon [\NUMA Node Memory(_Total)\Available MBytes] and sys.dm_os_sys_memory.available_physical_memory_kb.
MEMORYSTATUS [Available Paging File] measured in bytes appears to be free paging file plus MEMORYSTATUS [Available Physical Memory]. MEMORYSTATUS [Available Paging File] appears to be the same resource as sys.dm_os_sys_memory.available_page_file_kb.
What about MEMORYSTATUS [Available Virtual Memory]? It seems so much higher than other measures. Pulling in the MEMORYSTATUS value from above...
Available Virtual Memory = 136302950027264 B = 123.97 TB
Here's a similar number...
total_virtual_address_space_kb = 137438953343 kb = 128 TB
The value from dm_os_process_memory was retrieved several days after the other values in this blog post. *And* after a SQL Server service restart.
This KB article explains that SQL Server process virtual address space starts at approximately 8TB in Windows Server 2012. But it also mentions "Windows 2012 R2 [and above] allows virtual address space to grow as large as 128 TB".
kb3074434
FIX: Out of memory error when the virtual address space of the SQL Server process is very low on available memory
https://support.microsoft.com/en-us/help/3074434/
That's all for now, folks.


